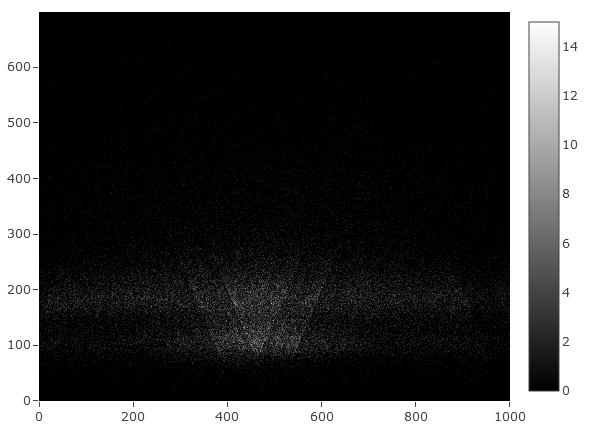
vplot is a small Rust tool for generating V-plot matrices. By default it makes
matrices using the original style of fragment midpoints developed in Henikoff,
et. al. 2011, but it also supports
making plots from fragment ends, or mapping the whole fragment instead. These
features make vplot a versatile tool for visualizing MNase-seq, ATAC-seq, or
CUT&RUN data.
Download a compatible binary for your operating system from the Releases Page. Can't find one that works? File an issue, or compile from source (instructions below).
Place binary in convenient location (ie ~/bin), add that location to your PATH if it isn't already.
# Adds ~/bin to PATH
echo "export PATH=\$PATH:~/bin" >> ~/.bashrc
Test install:
vplot --versionInstall Rust. It's super easy!
Install the binary
cargo install --git https://github.com/snystrom/vplotTest install
vplot --versionvplot takes aligned reads as an indexed bam file and a bed file of genomic
coordinates as input to return a CSV-format matrix of fragment size plotted
against genomic coordinates. vplot can create aggregate plots of multiple
regions by providing multiline entries in the regions bed file, or can create
matrices for each region separately by setting the --multi flag, in which case
a separate matrix per region will be written.
In the returned matrix, the columns are genomic coordinate (leftmost
column is 5' end), and rows are fragment size (top row is largest fragment size).
In keeping with the original spirit of the original Henikoff V-plot, larger fragments are
returned at the top of the matrix, while small fragments are plotted along the
bottom. This can be a little annoying for indexing later, though, because row 1
corresponds to the max fragment size. To make rowwise positional indexing
easier, set --invert to return smaller fragments at the top of the matrix
(i.e. row 1 = 1bp fragment size).
Finally, by setting --fragment-type (-f) you can control how reads are
summarized in the matrix. Setting -f midpoint (default) only adds signal at
the midpoint of a fragment. Setting -f ends adds signal at the start and end
positions of each read. Setting -f fragment adds signal along the full length
of the read fragment. Typically, midpoint is what you want, but plotting whole
fragments or fragment ends could be useful for different assays & data visualization.
Like examples? Here you go:
# regions must be equal width
# and must be in bed4 format
$ cat regions.bed
chr2L   100 200 .
chr3R   5000 5100 .

# remember to index your bam file
$ samtools index reads.bam

# default behavior aggregates reads & prints to stdout
$ vplot reads.bam regions.bed > vplot_matrix.csv

# make vplots for each region separately instead with --multi
# this writes a file per region
$ vplot --multi reads.bam regions.bed
    # returns:
    chr2L-100-200.vmatrix.csv
    chr3R-5000-5100.vmatrix.csv

# set a custom file prefix for multi-output files:
$ vplot --multi -o myPrefix_ reads.bam regions.bed
    # returns:
    myPrefix_chr2L-100-200.vmatrix.csv
    myPrefix_chr3R-5000-5100.vmatrix.csv

$ vplot --html -o ./ reads.bam regions.bed
   # returns:
   reads.bam.vmatrix.csv
reads.bam.vplot.htmlvplot can also be used to generate vplot heatmaps. By setting --html,
vplot will export an interactive vplot heatmap in html format that can be
viewed in a web browser.
View an interactive example.
vplot 0.3.41

USAGE:
    vplot [FLAGS] [OPTIONS] <bam> <regions>

FLAGS:
    -h, --help
            Prints help information

    -i, --invert
            Invert the matrix so that the smallest fragments appear at the top

    -m, --multi
            Instead of aggregating reads into 1 matrix, write 1 matrix for each region. Matrices are written as 1 csv
            per region named: `chr-start-end.vmatrix.csv`
    -V, --version
            Prints version information

        --html
            Write an interactive vplot heatmap in HTML format. Files are suffixed with `.vplot.html` following the rules
            outlined in the `--multi` helptext.

            If --html is set but -o is unset, heatmap will be written to "{bamfile}.vplot.html".

OPTIONS:
    -f, --fragment-type <fragment-type>
            How reads are counted in the matrix. Using either the midpoint of the fragment, fragment ends, or the whole
            fragment [default: midpoint]  [possible values: midpoint, ends, fragment]
    -x, --max-size <max-fragment-size>
            Maximum fragment size to include in the V-plot matrix [default: 700]

    -o, --output <output>
            Set output file name or output directory. This option behaves differently depending on which input flags are
            set. See --help for details.

            If --multi is unset and -o is set to a directory, the output file will be written to:
            outdir/<bamfile>.vmatrix.csv. if --multi is unset and -o is a file path, output file will be written to this
            file name. if --multi is set and -o is a directory, files will be written to outdir as: outdir/chr-start-
            end.vmatrix.csv. if --multi is set and -o is a string, the string will be used as a prefix,
            and files will be written as: <prefix>chr-start-end.vmatrix.csv.

            Examples:

            vplot reads.bam regions.bed > output.vmatrix.csv

            vplot -o outdir/ reads.bam regions.bed

            returns: outdir/reads.bam.vmatrix.csv

            vplot -o matrix.csv reads.bam regions.bed

            returns: matrix.csv

            vplot -m -o outdir/ reads.bam regions.bed

            returns: - outdir/chr1-1000-2000.vmatrix.csv

            - outdir/chr2-1000-2000.vmatrix.csv

            vplot -m -o myPrefix_ reads.bam regions.bed

            returns:

            - myPrefix_chr1-1000-2000.vmatrix.csv

            - myPrefix_chr2-1000-2000.vmatrix.csv

            vplot -m -o outdir/myPrefix_ reads.bam regions.bed

            returns:

            - outdir/myPrefix_chr1-1000-2000.vmatrix.csv

            - outdir/myPrefix_chr2-1000-2000.vmatrix.csv [default: -]

ARGS:
    <bam>
            Path to an indexed bam file

    <regions>
            Path to a bed file (must be in bed4 format: chr, start, end, name) Of a region (or regions) in which to
            generate the vplot. If using multiple regions, all entries must be the same width. If setting multiple
            regions, reads will be aggregated into a single matrix unless `--multi` is set