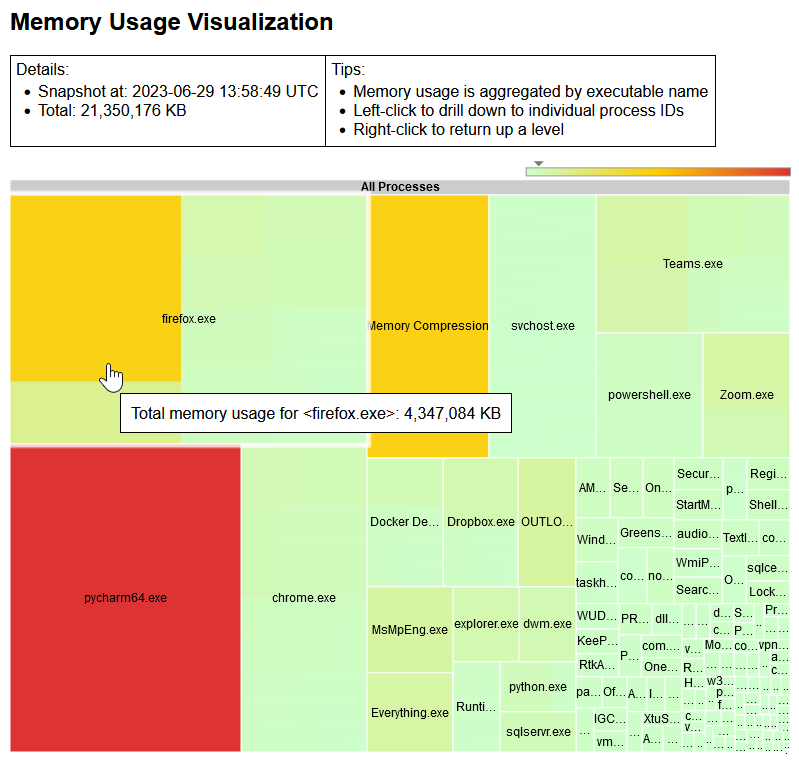
Graphical visualisation of memory usage across all Windows processes.
Renders tasklist output to a Google Charts TreeMap
with space proportional to RAM usage (working set).
Processes are grouped by executable name (e.g. chrome.exe) so multi-process apps are summed together.
# From CMD (or git bash which helpfully has perl built in)
perl MemTreeMap.pl > memoryusage.html && start memoryusage.html

# From powershell:
perl MemTreeMap.pl | Out-File -Encoding Utf8 memoryusage.html ; start memoryusage.html
Based on https://juanpalomez.wordpress.com/2013/04/18/memory-usage-treemap-windirstat-for-memory/
This is not a particularly pretty script but it works and was useful to me.
As with all memory usage reports, the numbers may not match other software reports of 'memory usage' depending how they are counting.
For example I believe tasklist uses 'Working set' whereas Task Manager uses 'Working set Private' which excludes shared pages.
This script does not account for all possible memory usage such as 'Driver Locked' (e.g. from Hyper-V) so I recommend using RAMMap too e.g. if the total here is much lower than the total memory usage reported by task manager.
The colours are based on the individual process usage (not the group) so multi-process apps appear less red.
