The csv/xlsx file needs to have columns "begin", "end", "days", and whatever text you want in the schedule boxes:
| begin | end | days | Label1 | Label2 | Label3 | |
|---|---|---|---|---|---|---|
| 0 | 08:00 AM | 08:50 AM | MW | One | Two | Three |
| 1 | 10:00 AM | 11:50 AM | TRF | Yes | No | Maybe |
| 2 | 03:00 PM | 03:50 PM | MWF | Foo | Bar | Baz |
For this CSV you could use this command line:
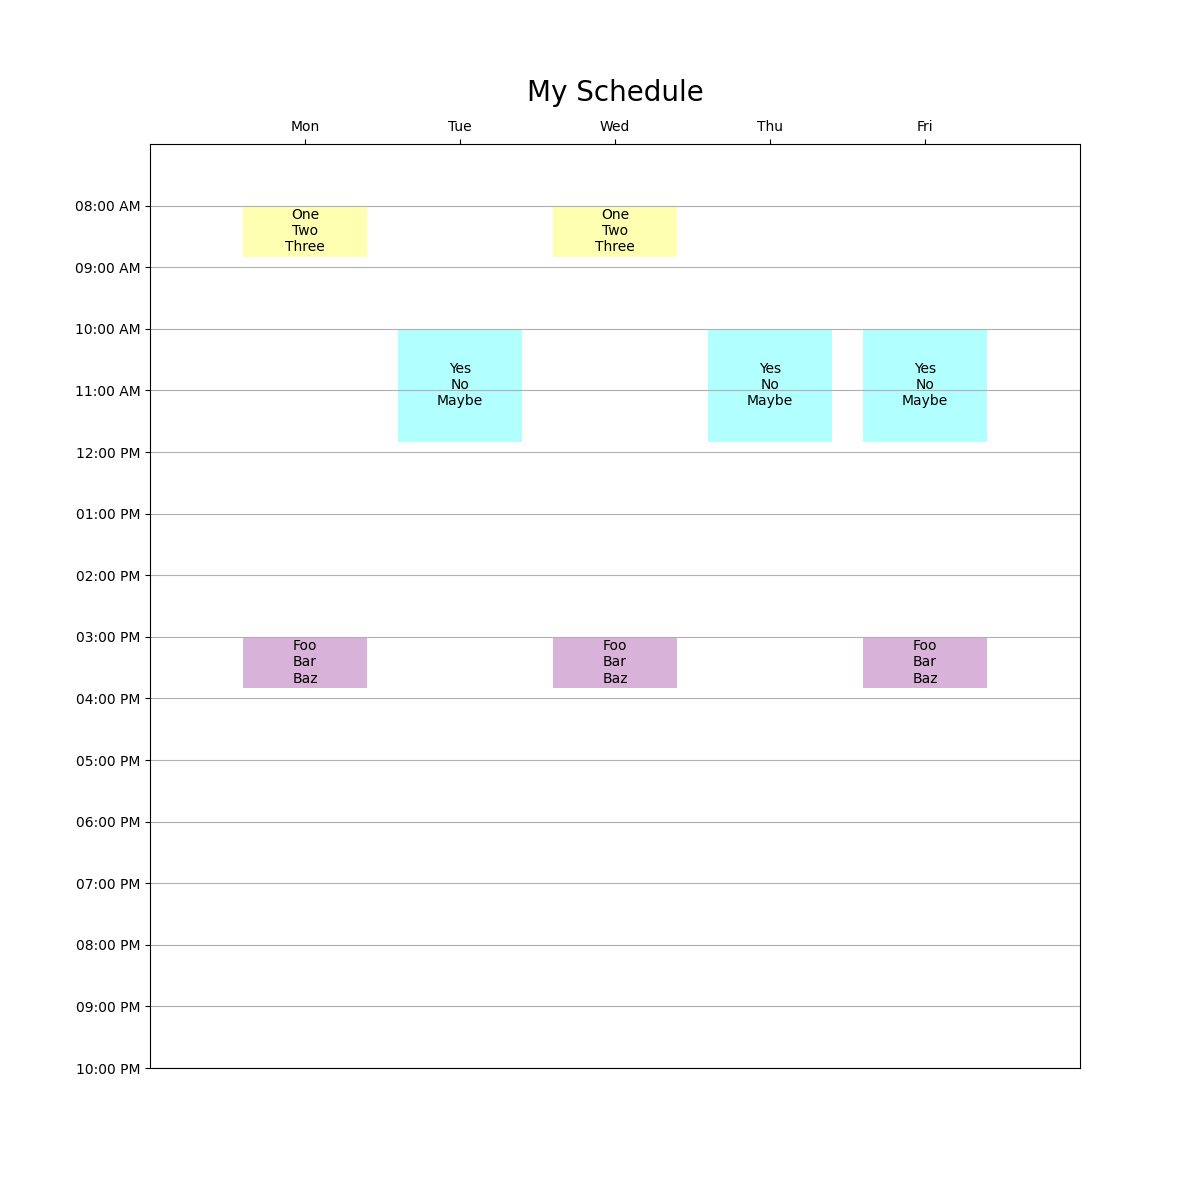
plotschedule --output bar.png --title "My Schedule" example/foo.csv --labels Label1 Label2 Label3
And you'd get this output:
You can also add a color column and use matplotlib colors.
Changes: 0.11 now works with excel too!
Changes: 0.12 allow for times that are already converted into 'float' hours (e.g. 8:30 AM -> 8.5, etc.)
Changes: 0.14 (yeah, skip 0.13!) reorganize init.py to put the function an module scope.
Changes: 0.15 Added --sheet argument to pull a particular sheet from an excel file.