keyboard-driven concept mapping visualization in emacs + python, featuring
- non-overlapping nodes
- animated transitions
- toggleable node text
- force-directed or hierarchical layout
Throughout my studies, there were many I had to structure complex information from various sources such as articles, books, lectures or conversations. Detailed nodes of individual did not connect common bits of information. Literature tables imposed an overly rigid structure. Sketches of relationships between concepts would soon fill the paper and aggravate the addition of more recent information.
obvz is an attempt to manage these concepts relations in a more effective approach.
- org-brain, which requires at least emacs 25.1.
python3: it definitely works for me with 3.6 and 3.7.PyQt5: I don’t quite know how to navigate jungle of the various packages across which the PyQt5 functions are distributed. On Ubuntu 18.04 I needpython3-pyqt5andpython3-pyqt5.qtsvg, I’m not sure how other distributions/OSs handle it. maybe PyQt5 can also be completely installed in pip3.graphvizas a system package as well as its python bindings (available in pip3).numpy, networkx, Pillow: available in pip3.
obvz offers multiple possibilities to communicate between emacs and Python:
- dbus (default; it requires no further packages due to native dbus support in emacs and PyQt).
- zmq, in which case bindings for python and elisp have to be installed.
- this also requires uncommenting the “zmq section” at the bottom of obvz.el.
the connection type can be specified by setting obvz-connection-type.
- setq
obvz-dirto the main folder directory. - setq
obvz-python-versionto your python3 version. - load the
obvz.elfunctions/variables (obvz is not a complete package yet).
- run
M-x obvz-startto open a PyQt window (alternatively, run obvz.py in a terminal, in which case connection type and layout have to be specified). - when done, close the PyQt window and run
M-x obvz-stopto unload the obvz functions from the org-brain hooks.
It seems to me that a key aspect of data visualization in general and network visualization in particular is to focus only on the few relevant parts of the brain. Consequently, large parts of obvz involve slicing and dicing the org-brain in customizable ways.
Edge direction: I myself prefer directed edges. While hierarchical relations go from parents to children and are hence obviously directed, direction is less straightforward with friend relationships. To solve this issue and give direction to org-brain's friend relationships, obvz uses edge annotations. These edge annotations are created in org-brain either as bi-directional (e) or one-directional (C-u e). The role of edge annotations can be customized with obvz-only-use-annotated-edges.
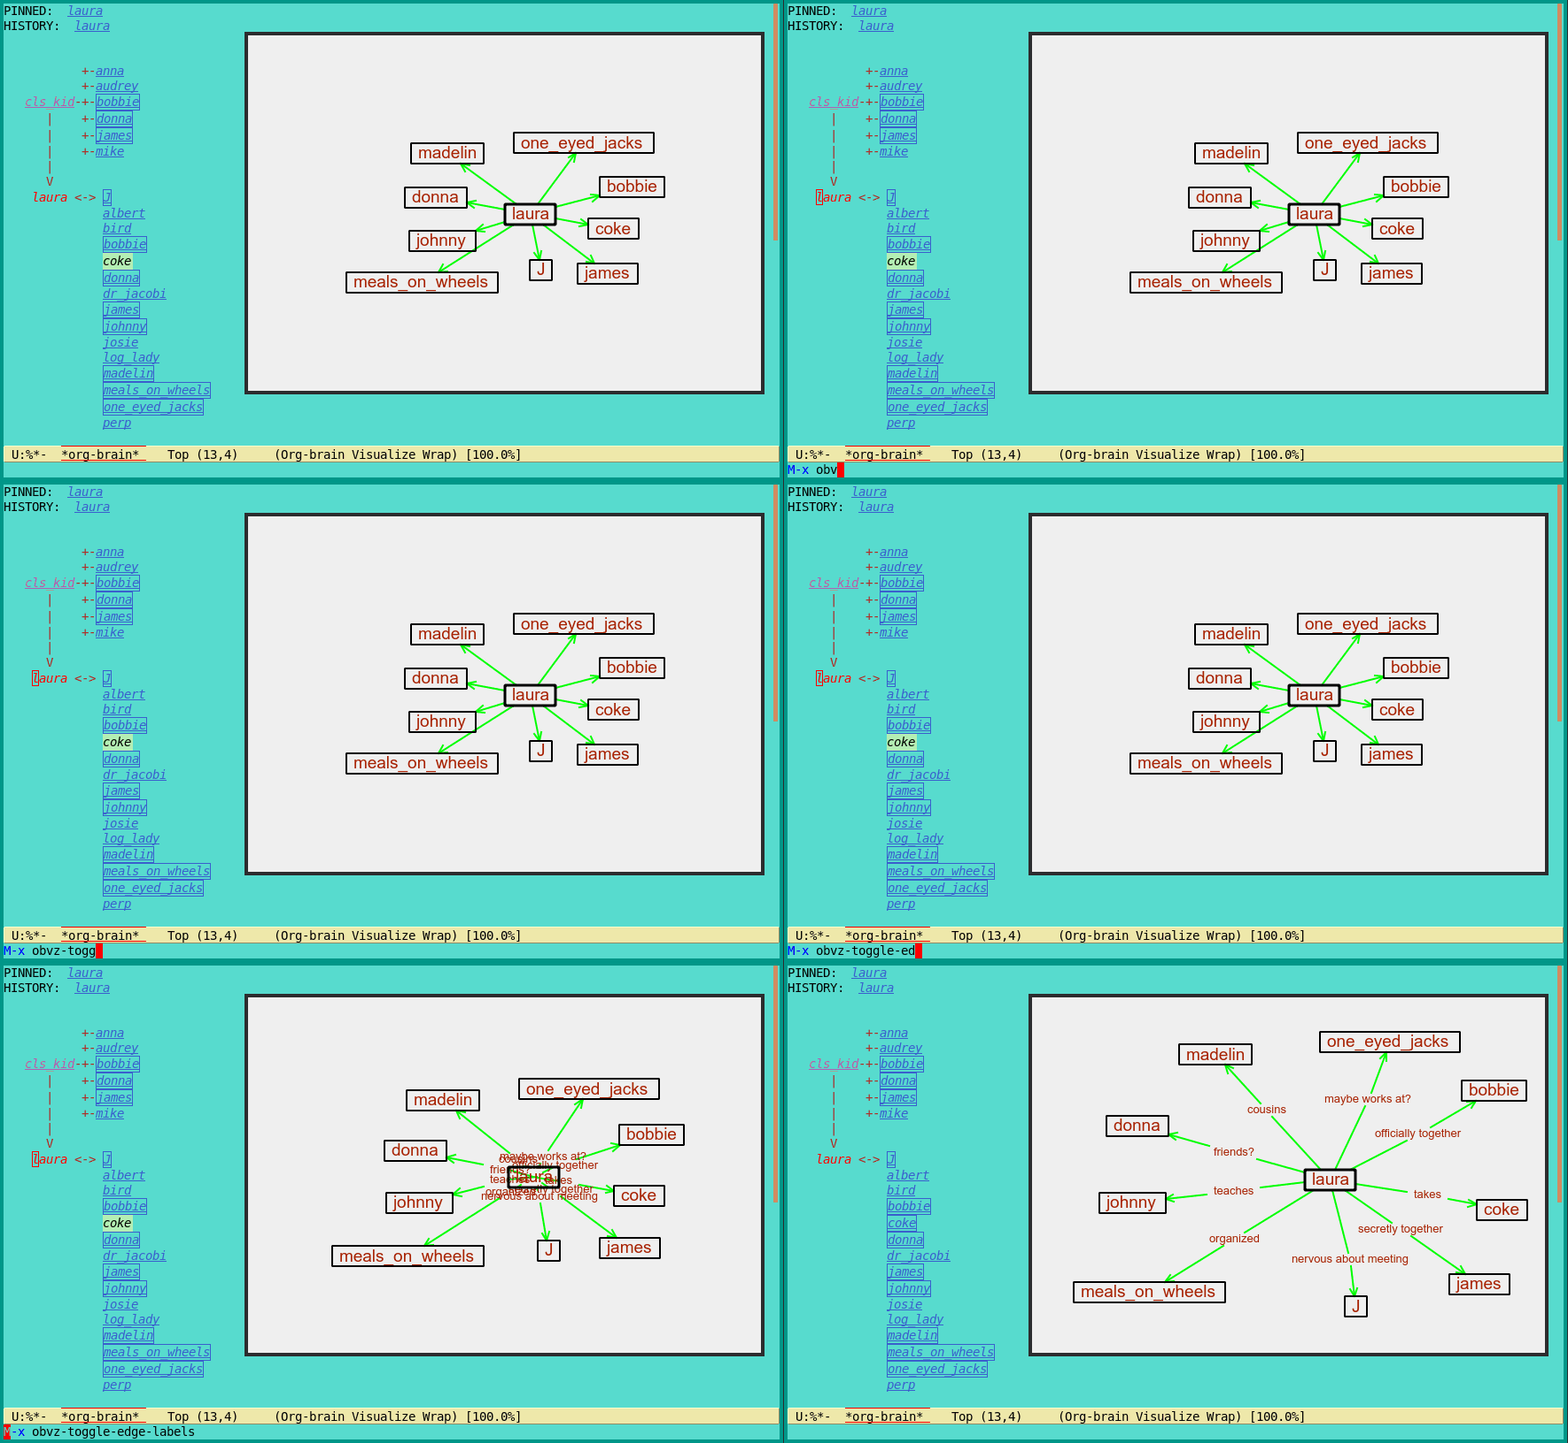
Edge label visualization can be toggled on and off with E (obvz-toggle-edge-labels).
Node selection works via org-brain’s feature of pinning nodes (n), which visualizes
- the node itself
- friends (to which the edges are annotated)
- children (parent-child relationships are visualized as well)
- friends of children (to which the edges are annotated)
Class nodes can be used to select nodes quickly. A class node starts with “cls_” and is intended to be parent to nodes of the same kind, such as people, places, or objects. Since class nodes are normal org-brain nodes, objects can be members (i.e. children) of multiple classes. Class nodes are intended only for node selection and are not visualized themselves when pinned.
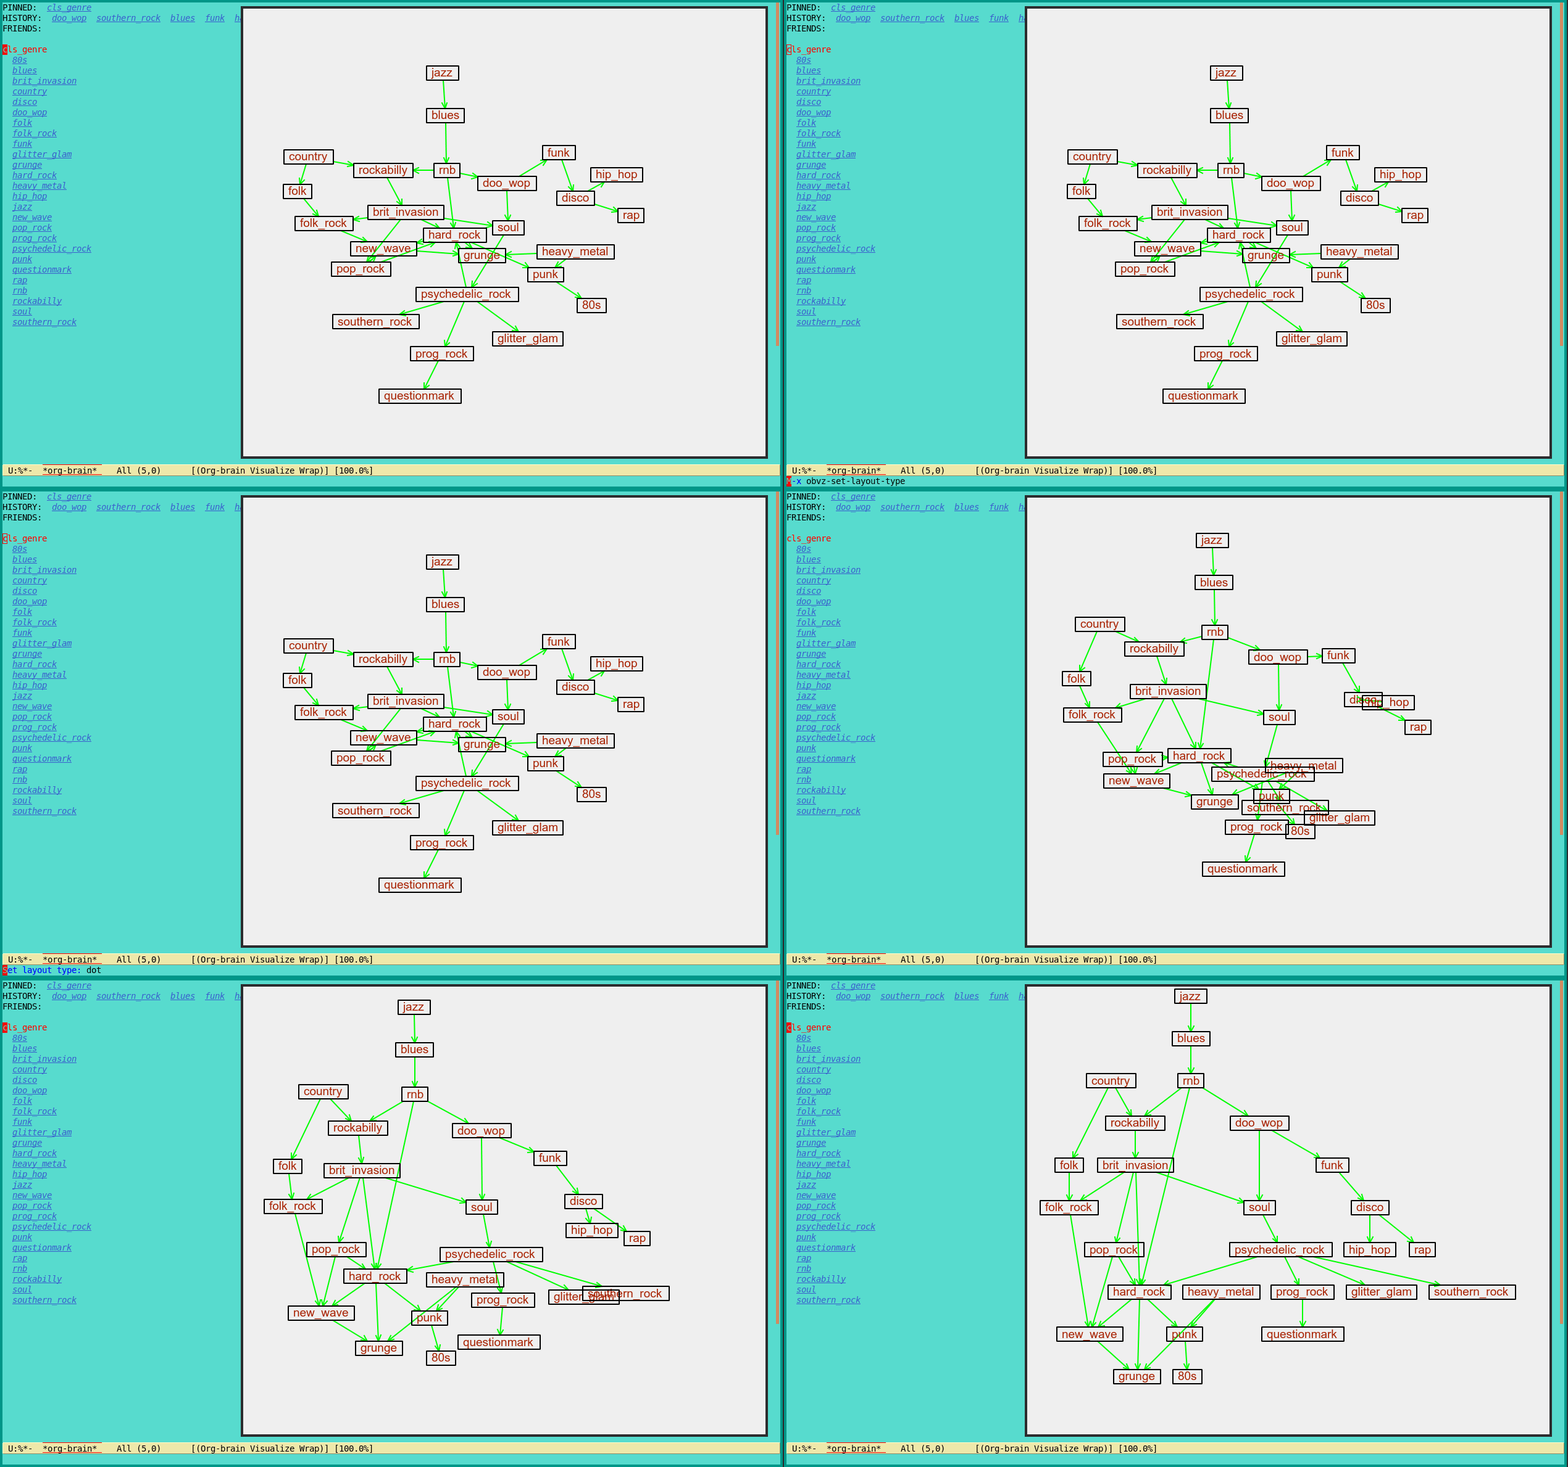
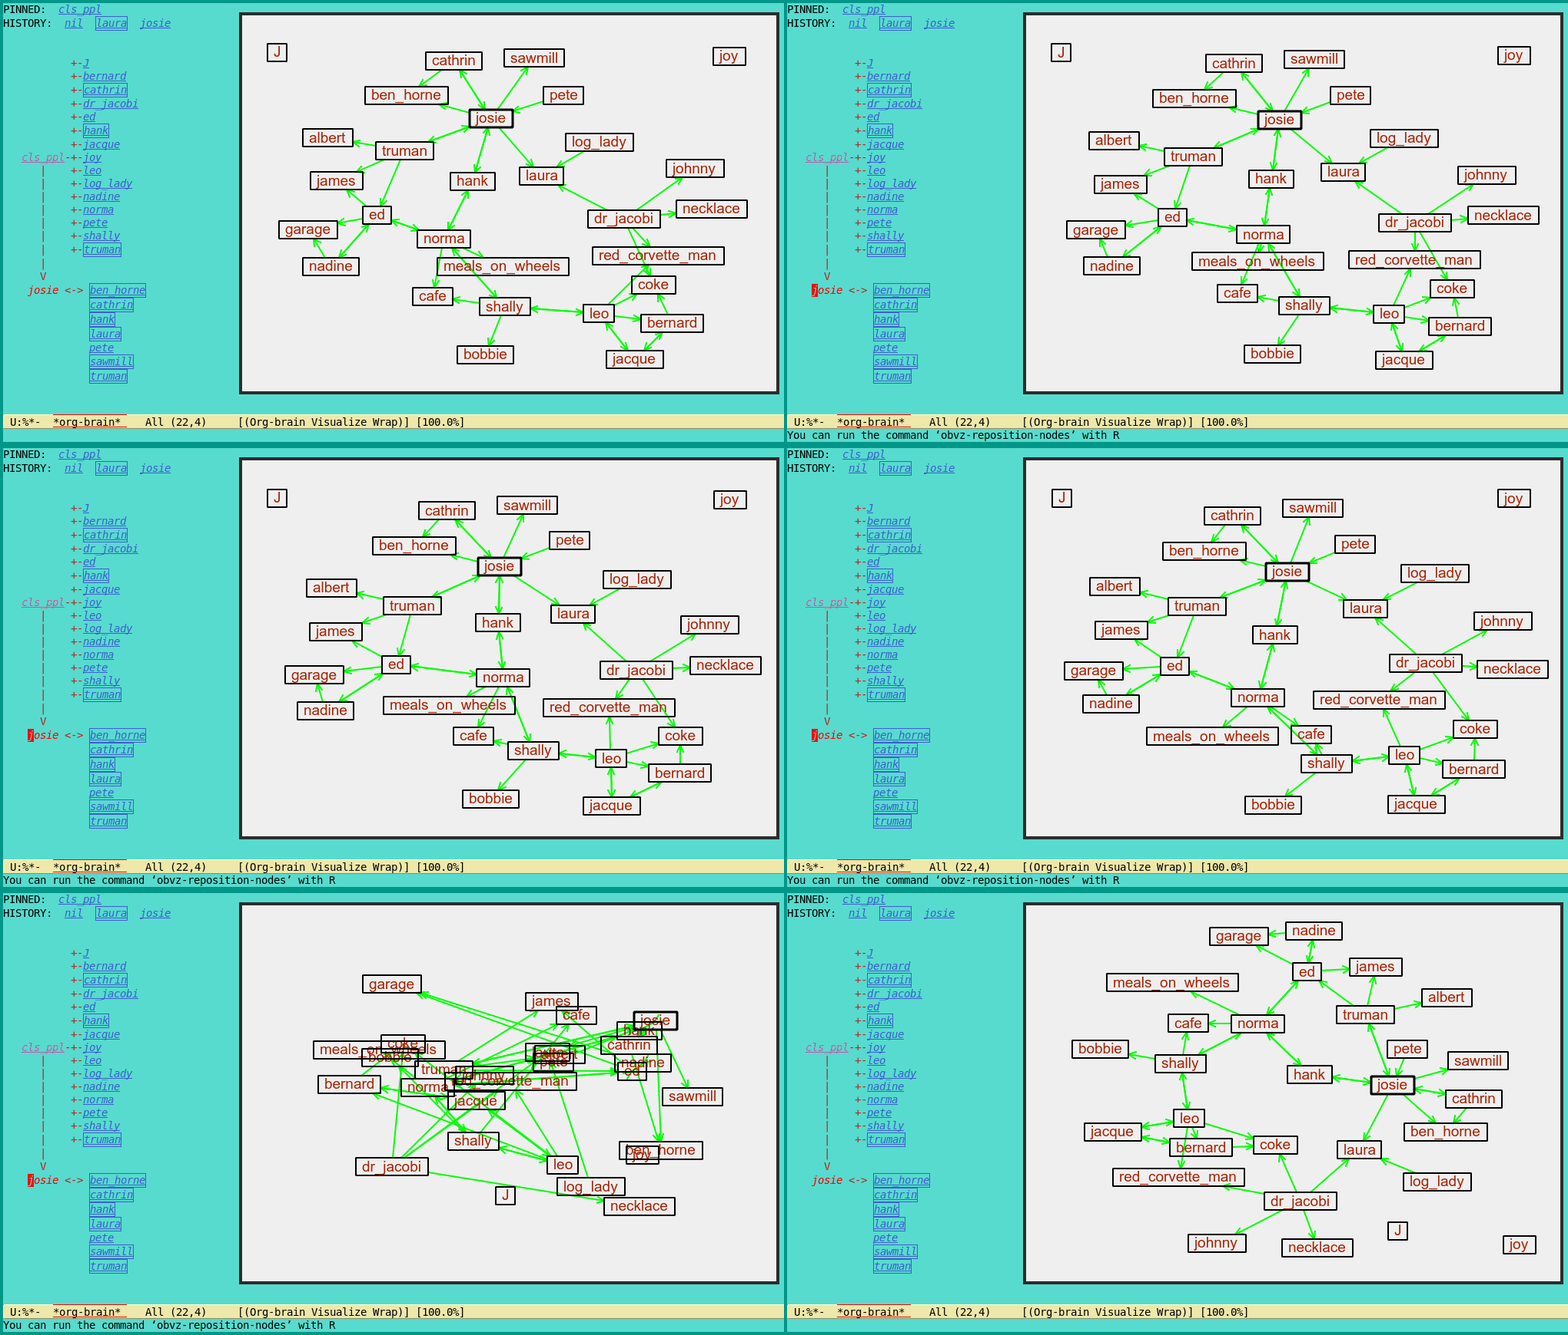
Layout: it is possible to view the graph in a force-directed layout (named “force”) or the graphviz hierarchical dot layout (named “dot”) with M-x obvz-set-layout-type. While the dot layout is deterministic, the force-directed layout is unlikely to produce the same node positions every time. In the force-directed layout, new node positions can be generated via R (M-x obvz-reposition-nodes):
- normal execution does minor modifications (it re-applies the force-directed drawing algorithm to the current layout); this can sometimes “iron out” “knots” in the graph.
- execution with prefix
C-ugenerates a new layout based on random starting positions.
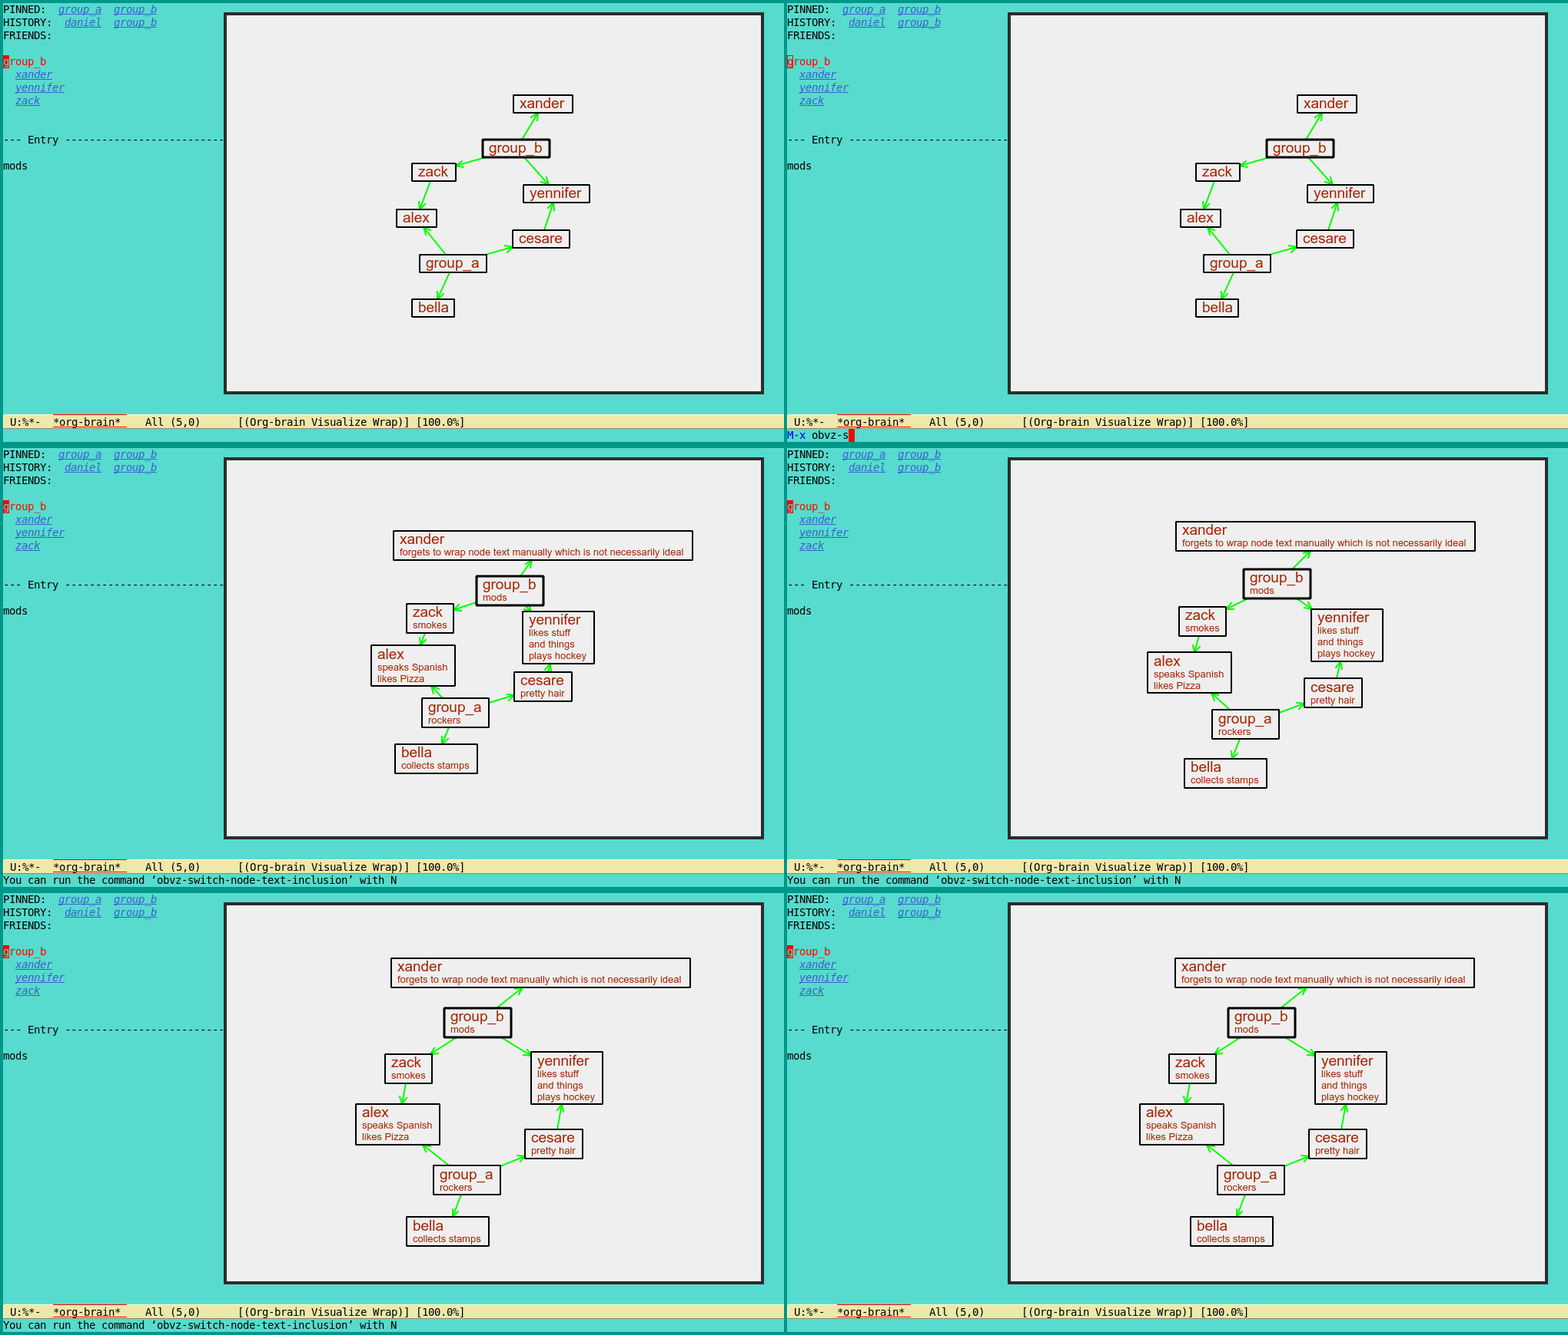
Node text: switch display of node body text on and off with N (M-x obvz-switch-node-text-inclusion). The node body text follows the same convention as in org-brain-visualize, i.e. file/entry text until next headline.
obvz-only-use-annotated-edges: whether friend links are only included when annotated (defaultt). (tis not strictly necessary for the dot layout, but strongly recommended).obvz-draw-arrow: whether arrowheads are drawn at the tips of edges (defaultt).obvz-highlight-current-node: whether the currently selected node is highlighted (defaultt).
obvz is intended primarily as a digital sketch board rather than a sophisticated visualization tool. For more sophisticated visualization I recommend to export the displayed graph to dot with M-x obvz-export. If the quick-and-dirty visualization of obvz are considered sufficient, M-x obvz-export can also export the current window content to svg.
- node body text is (currently) not being automatically wrapped; it has to be manually ensured that nodes do not become too wide or long.
- changes in the graph are mostly updated automatically, with two exceptions:
- changes of the node body text.
- restarting obvz after it has been closed a previous time.
- in these cases, the layout can be updated with
U(M-x obvz-update-graph).
- the force-directed layout algorithm (layout_optim/fruch_v3.cpp) can also be compiled manually with pybind (e.g.
g++ -O3 -Wall -shared -std=c++17 -fPIC `python3 -m pybind11 --includes` frucht_v3.cpp -o frucht_v3.so; the resulting .so file then has to be moved into the top directory). - it is not completely clear to me how node height and width work in the graphviz dot layout. the current configuration (resulting from trial and error) seems to prevent node overlaps, but it is unclear if they are completely avoided.
- the dot layout may not fit the screen.
- the dot layout may not be consistent if the graph is not acyclic.
- edge labels in the dot layout are somewhat janky.
- if node text is included when exporting to dot, special characters (like “&”) that can cause dot to malfunction have to be manually removed.
- bidirectional edges can make it difficult to identify which label belongs to which edge. I will likely fix that sometime by adjusting the layout algorithm.
- submit to MELPA
- enhanced datamodel: embed concept relationships in nodes (e.g. statements in documents)
- multiedges
- make PyQt window clickable
edge labels visualization- prevent edge overlap in reciprocal relations
- node properties visualization
- more node shapes
- more layout algorithms (plantUML?, mermaid?)
rewrite force-directed layout algorithm in C/C++- fixate/manually position nodes
- re-integrate with EAF
- minimize edges crossing nodes: repellent edges?
- virtual windows to quickly switch between graphs
- save/load layouts
Disclaimer: This is my first project of writing an application, as well as using Elisp and GUIs. Feedback, feature suggestions and bug reports are very welcome!


