- 一键实现图片位置、大小、字体、背景、网格、标注等设置
- 导出pdf
color: 自定义颜色表, 8种, 低版本 Matlab 用此画图更美观
color2: 另一自定义颜色表,4种
plot(x, y, 'color', FIG.color(n,:))   % n=1~8
plot(x, y, 'color', FIG.color2(n,:)) % n=1~4FIG.figSetting(fig, width, ratio, 'FontSize', 10, 'FontSizeIn',10, 'Journal', 'acess')fig(必选): 图片句柄, 当前图片可用 gcf 传入width(可选): 图像宽度/cm,默认 8ratio(可选): 图像高宽比,默认 0.75, 即默认高度 6cmFontSize(可选, name-value,下同): 坐标轴标注文字字号大小,默认10.5/五号FontSizeIn: 图内文字(legend,text)字号大小,默认10.5/五号Journal: 内置期刊名,提前定义好图片尺寸、图片文字的字体字号,目前只定义了acess,mythesis
其他默认设置
- 字体,中文统一宋体,英文数字统一
'Times New Roman' - 背景透明
- 网格开启,线型--,透明度0.3
- 四边框开启
- legend: 边框显示,白色背景,线宽0.5,位置'best'
- 箭头:头宽5,头长6,'vback3'风格
举例
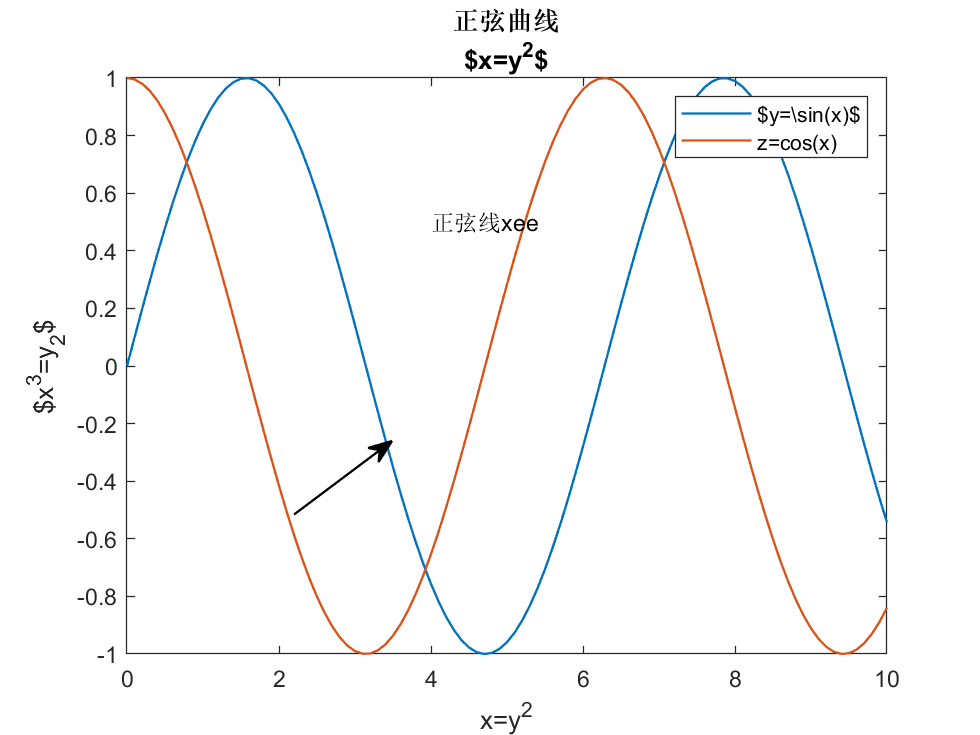
x = 0:0.1:10;
y = sin(x);
z = cos(x);
plot(x, [y; z])

title({'正弦曲线';'$x=y^2$'}) %todo bug
xlabel('x=y^2')
ylabel('$x^3=y_2$')
legend('$y=\sin(x)$', 'z=cos(x)') %fixed, $只有放在第一个表达式,才能解析出来

text(4, 0.5, '正弦线xee')
annotation('arrow')

FIG.figSetting(gcf, 12, 0.5)FIG.savepdf(fig, filename, filepath)fig: 图片句柄filename(可选参数): 保存文件名字符串,默认为MySavedFilefilepath(可选参数): 保存文件的路径,默认为系统桌面
- bug: 标题换行且中文与 latex 表达式同时出现
- bug: legend同时出现 tex 与 latex 表达式


