Get a monitoring station up and available. Seperated out into their own docker compose services that can be scaled up with the --scale feature. Allow anyone to have a monitoring setup locally and configured in a manner that an operations team can handle.
Follow instructions in the allservices directory to get a simple turn key solution on your machine
Follow the instructions to get a little more grandular and a structure where you can deploy in Cloud services with the ability to scale up and down
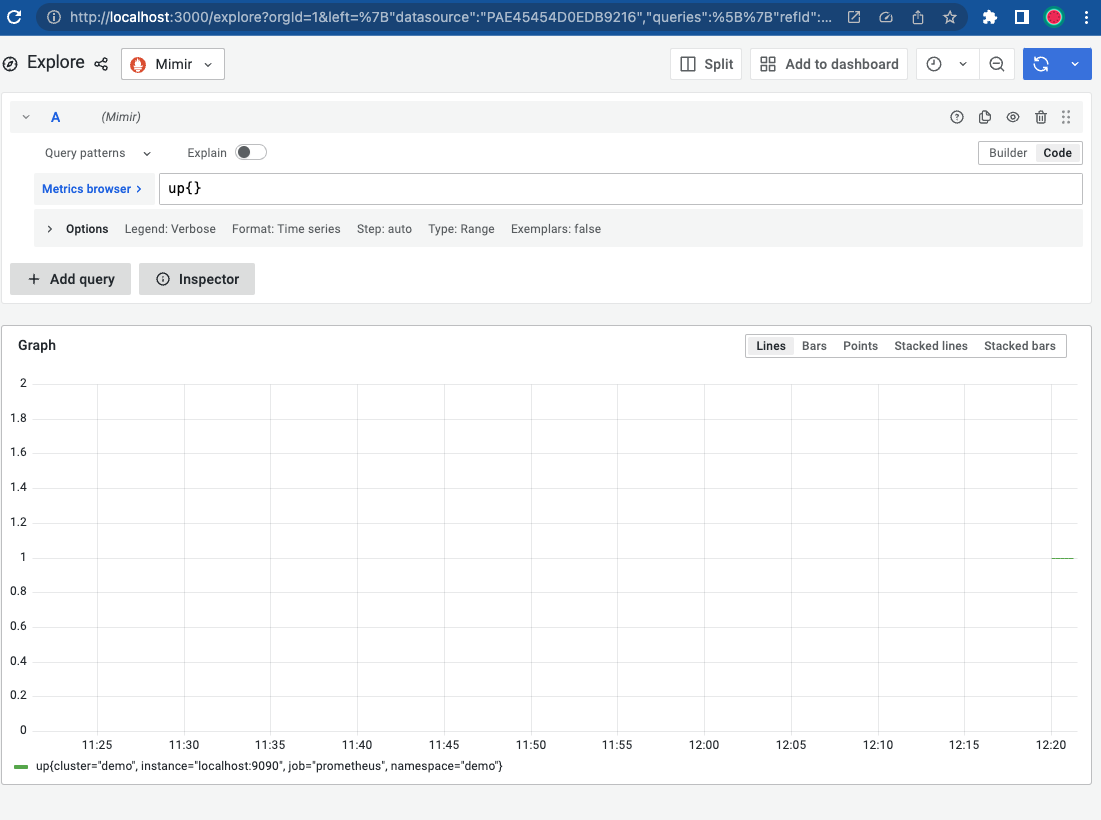
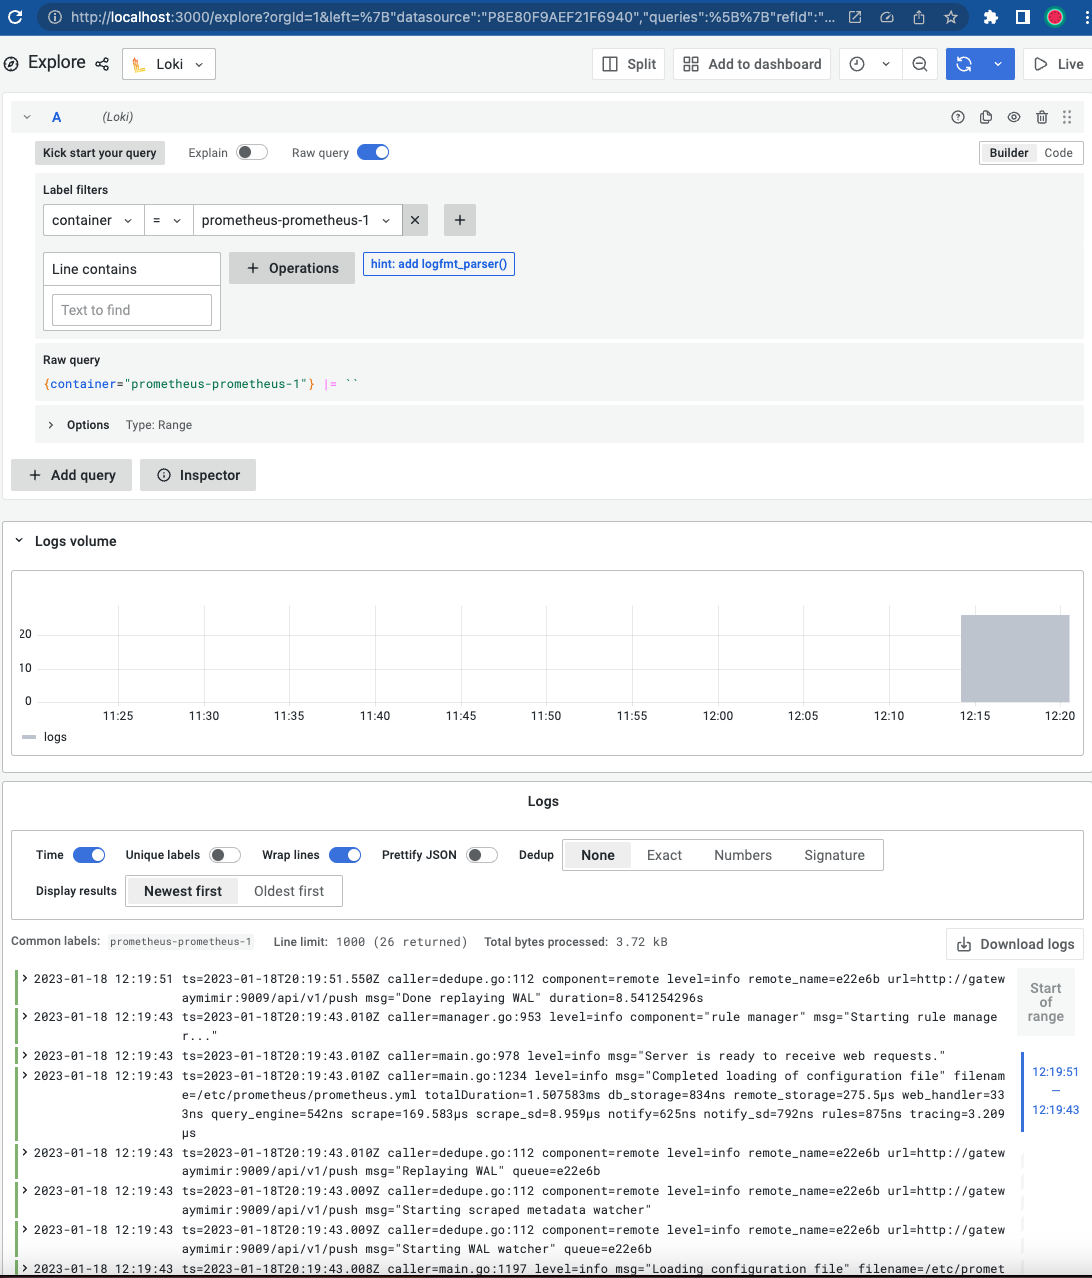
Checkout grafana explore at http://localhost:3000/explore
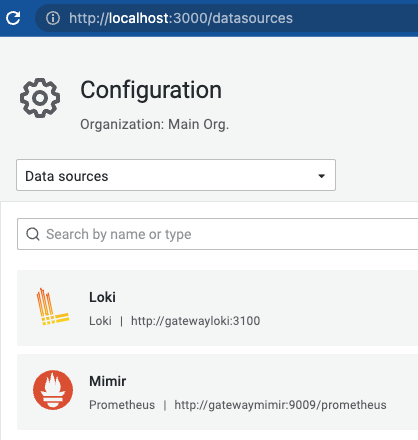
You will be able to query prometheus output through the Loki datasource for logs & Mimir for metrics
- Loki: http://localhost:3100
- Promtail http://localhost:9800
- Mimir: http://localhost:9009
- Prometheus: http://localhost:9090
- Grafana: http://localhost:3000
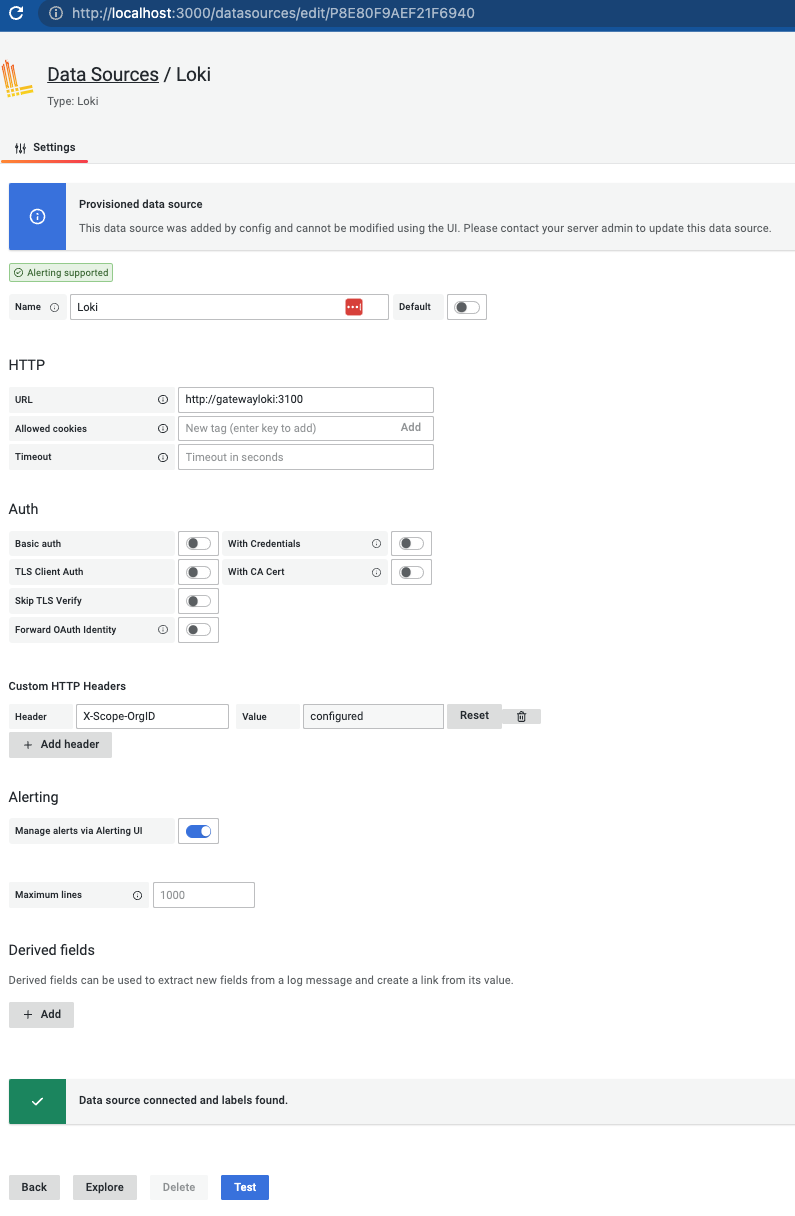
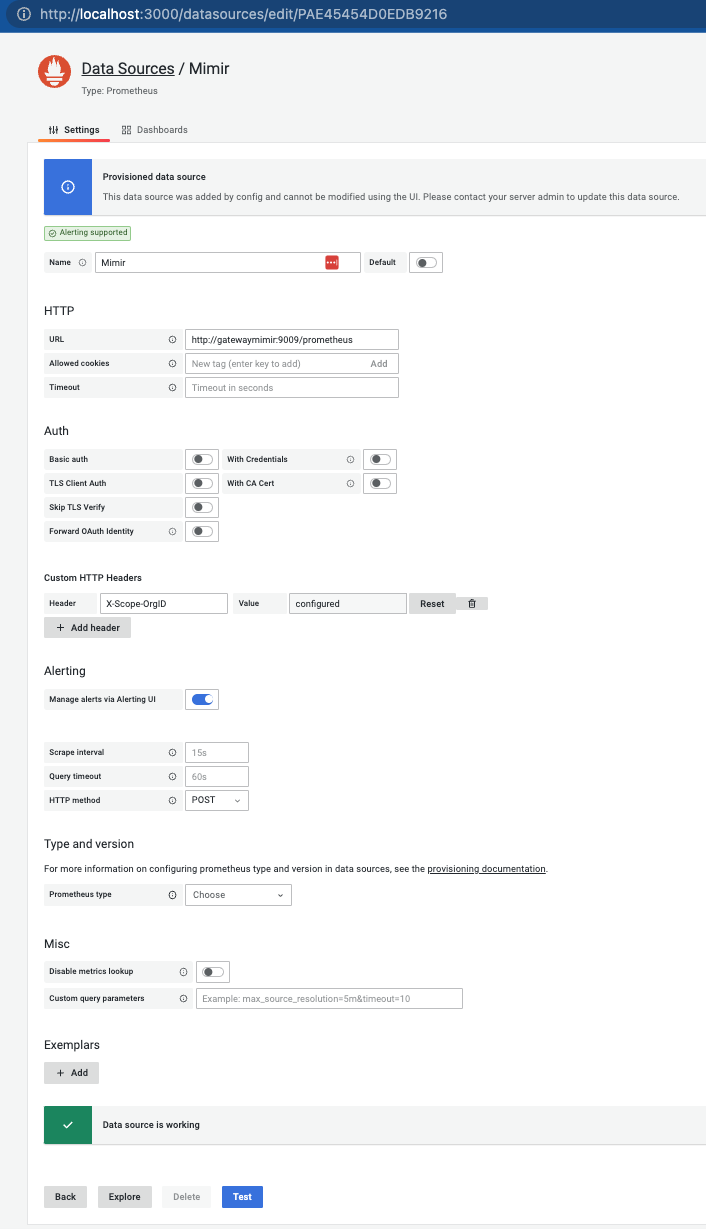
Our backend services use Tenant IDs through the header X-Scope-OrgID. Prometheus sends it's metrics through it's config file with mimirlocal & Promtail sends it's logs with lokilocal. Grafana is configured to use these. Use proper organization structure to keep environments clean by using these tenant IDs
Inside loki and mimir, they both use S3 storage points with an access_key_id and secret_access_key with access their own "S3" bucket. Be sure to handle these parts properly with cloud deployment structure and secret management
- Logs will be captured from the promtail config file to loki
- Metrics are captured through prometheus and sent to mimir
- Grafana has both data sources defined when brought up, you can start adjusting your prometheus config and promtail config to add in your other
- All services are scalable because they are defined using gRPC communcation to talk with each other.
- There are load balancers in front of both backends so you can get to them on your browser
- Both Mimir and Loki use a service called minio to simulate an S3 like backend, it's intended that all provisioned storage is through that type of service that is flushed with loki and mimir over time.
- When you want to deploy to a cloud service, you already have a built in scaling by component for both Mimir and Loki
All the data should be saved in .data/ for mimir and loki. That data doesn't not actually get saved until you flush either backend to be saved
- Clean up containers:
docker ps -qa | xargs docker rm - Clean up images:
docker images -q | xargs docker rmi - Clean up networks:
docker network prune - Force destroy all docker components:
docker system prune --all --force --volumes
I feel like people are intimidated with Kubernetes and the high requirements of other services. I wanted to get something approachable that includes sample applications like a node service, a python app or something along those lines. I will be including cadvisor and sample applications to showcase everything
This was inspired by a few tutorials and demos.
- Play with Mimir: https://grafana.com/tutorials/play-with-grafana-mimir/
- Loki getting started: https://github.com/grafana/loki/tree/main/examples/getting-started
- New in Grafana Loki 2.4 https://www.youtube.com/watch?v=M8nYWBpbwWg
- Ward Bekker's gist: https://gist.github.com/wardbekker/6abde118f530a725e60acb5adb04508a
- Getting started with Grafana Mimir: https://www.youtube.com/watch?v=pTkeucnnoJg
