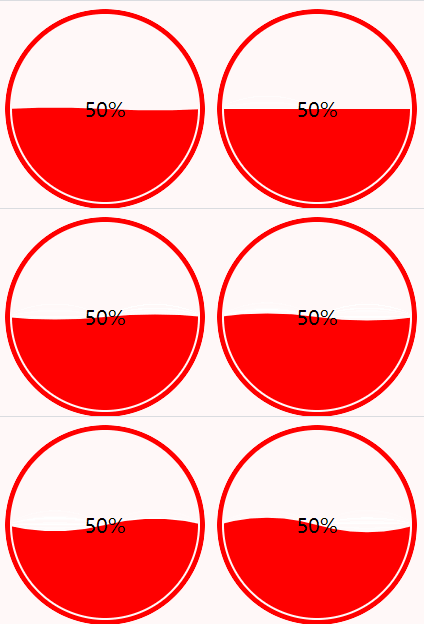
Vue module for creating chart like echarts-liquidfill by SVG in your application.
Vue.js 2.x
$ npm i vue-waterball -S
$ yarn add vue-waterball
main.js
import Vue from 'vue';
import WaterBall from 'vue-waterball';

Vue.component('WaterBall', WaterBall);
template:
<WaterBall />
| Attribute | Description | Type | Accepted Values | Default |
|---|---|---|---|---|
| size | width and height of component | number | - | 200 |
| percentage | value from 0 to 1 | number | 0 to 1 | 0.5 |
| border-width | width of border | number | - | 5 |
| border-color | color of border | string | - | '#F00' |
| padding | the distance between border and water | number | - | 2 |
| background-color | background color of component | string | - | '#FFF' |
| water-color | color of water | string | - | '#F00' |
| dur | on animation cycle duration, millisecond | number | - | 5000 |
| amplitude | times of half size, from 0 to 1, bigger number represents bigger amplitude | number | - | 0.3 |
| wave-length | wave length, just use when type is 'horizontal' | number | - | 200 |
| font-size | font size | number | - | 20 |
| font-color | font color | string | - | '#000' |
| type | wave direction | string | 'horizontal' / 'vertical' | 'vertical' |
default slot will replace the center text.


