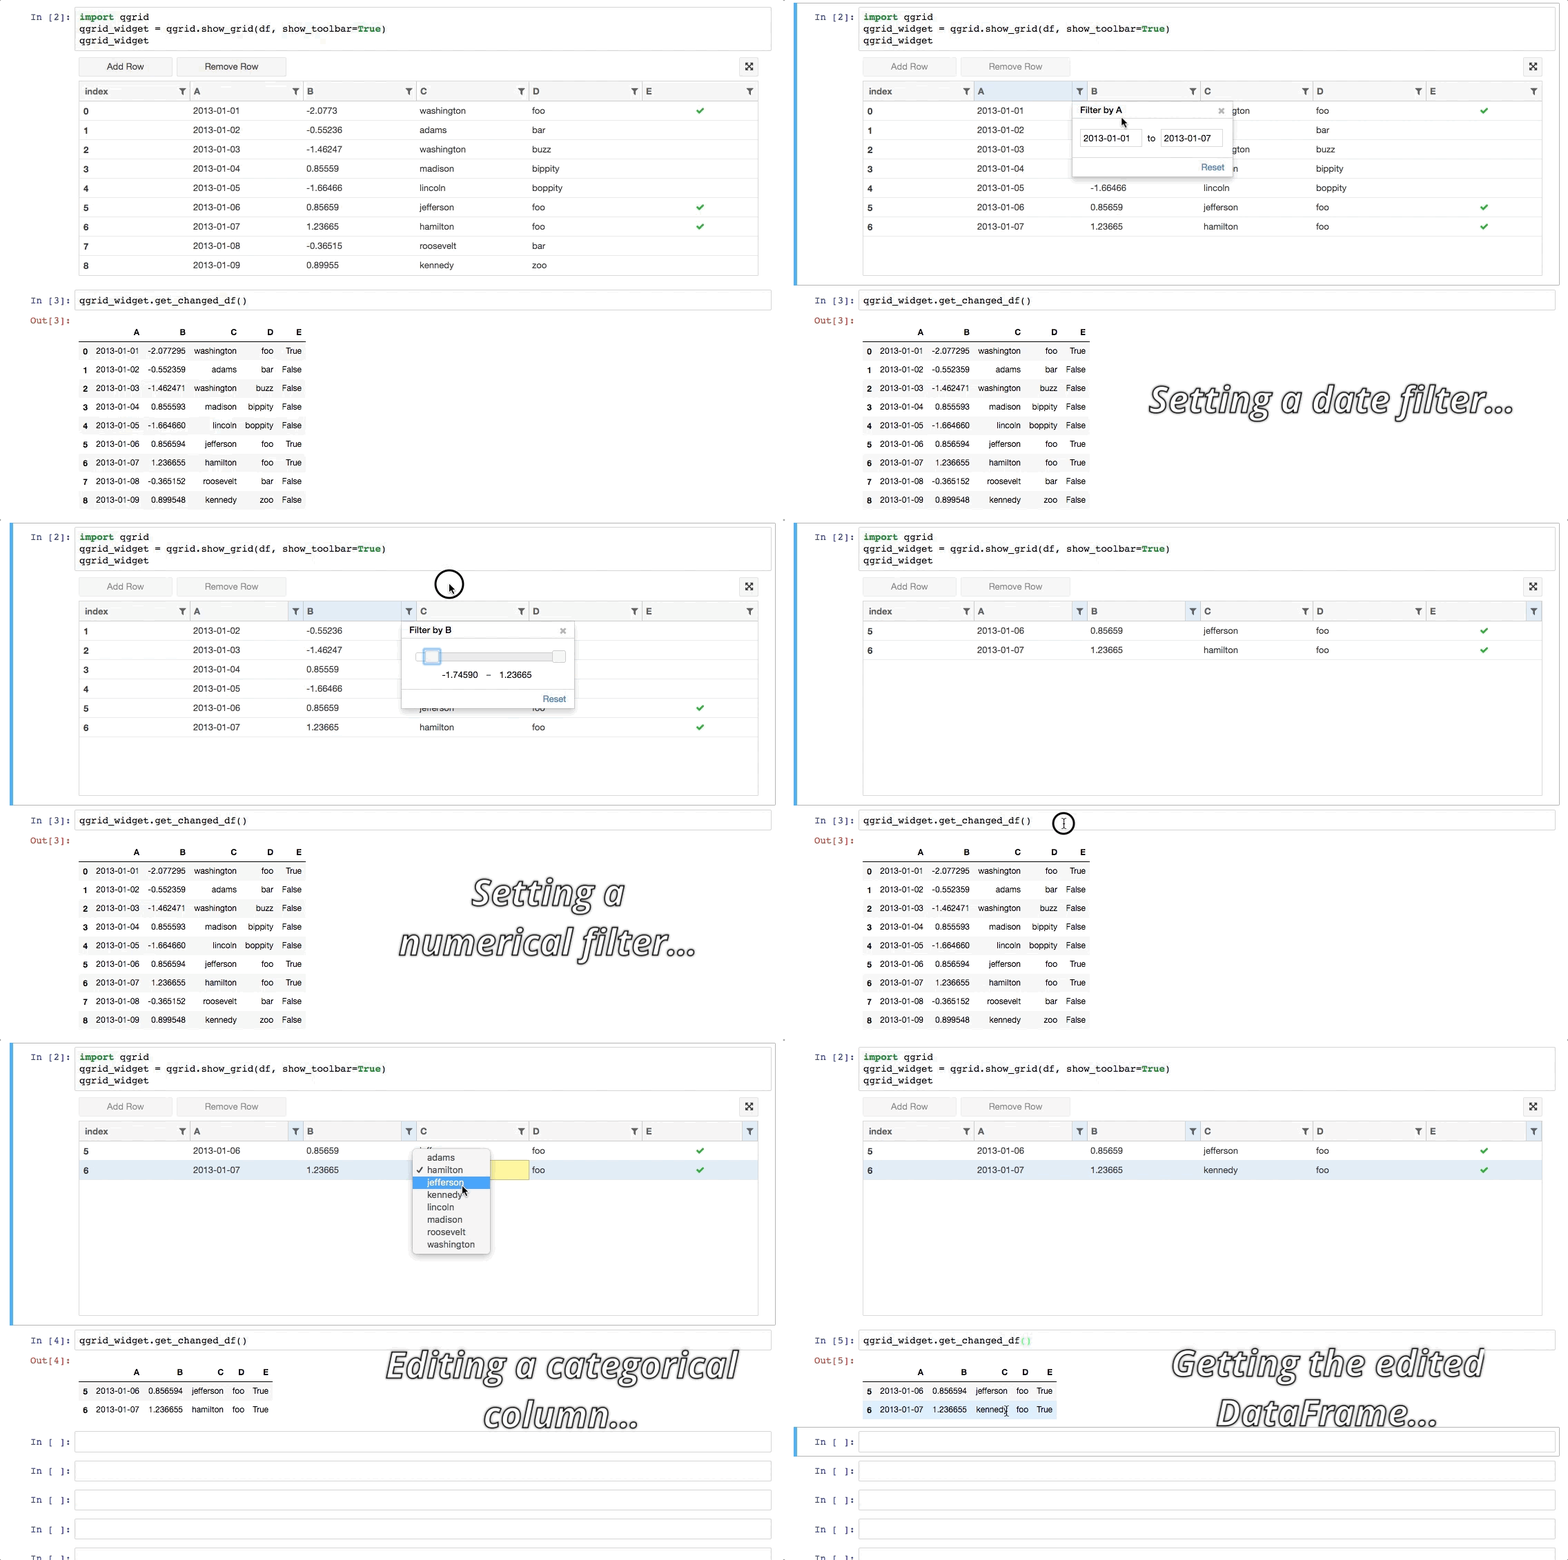
Qgrid is a Jupyter notebook widget which uses SlickGrid to render pandas DataFrames within a Jupyter notebook. This allows you to explore your DataFrames with intuitive scrolling, sorting, and filtering controls, as well as edit your DataFrames by double clicking cells.
We originally developed qgrid for use in Quantopian's hosted research environment in fall of 2014, but had to put it on the backburner for a while so we could focus on higher priority projects.
Qgrid development started up again in summer 2017, when we started a major refactoring project to allow qgrid to take advantage of the latest advances in ipywidgets (specifically, ipywidget 7.x). As a part of this refactoring we also moved qgrid's sorting, and filtering logic from the client (javascript) to the server (python). This new version is called qgrid 1.0, and the instructions that follow are for this new version.
Click the badge below to try out qgrid in a live sample notebook:
Click the following badge to try out qgrid in Jupyterlab:
For both binder links, you'll see a brief loading screen while a server is being created for you in the cloud. This shouldn't take more than a minute, and usually completes in under 10 seconds.
For people who would rather not go to another page to try out qgrid for real, here's the tldr; version:
API documentation is hosted on readthedocs.
Installing with pip:
pip install qgrid
jupyter nbextension enable --py --sys-prefix qgrid

# only required if you have not enabled the ipywidgets nbextension yet
jupyter nbextension enable --py --sys-prefix widgetsnbextension
Installing with conda:
# only required if you have not added conda-forge to your channels yet
conda config --add channels conda-forge

conda install qgrid
First, go through the normal installation steps above as you normally would when using qgrid in the notebook. If you haven't already install jupyterlab and enabled ipywidgets, do that first with the following lines:
pip install jupyterlab
jupyter labextension install @jupyter-widgets/jupyterlab-manager
Install the qgrid-jupyterlab extension and enable:
jupyter labextension install qgrid
At this point if you run jupyter lab normally with the 'jupyter lab' command, you should be able to use qgrid in notebooks as you normally would.
Please Note: Jupyterlab support has been tested with jupyterlab 0.30.5 and jupyterlab-manager 0.31.3, so if you're having trouble, try installing those versions. Feel free to file an issue if you find that qgrid isn't working with a newer version of either dependency.
Qgrid runs on Python 2 or 3. You'll also need pip for the installation steps below.
Qgrid depends on the following three Python packages:
- Jupyter notebook
- This is the interactive Python environment in which qgrid runs.
- ipywidgets
- In order for Jupyter notebooks to be able to run widgets, you have to also install this ipywidgets package. It's maintained by the Jupyter organization, the same people who created Jupyter notebook.
- Pandas
- A powerful data analysis / manipulation library for Python. Qgrid requires that the data to be rendered as an interactive grid be provided in the form of a pandas DataFrame.
These are listed in requirements.txt and will be automatically installed (if necessary) when qgrid is installed via pip.
| qgrid | IPython / Jupyter notebook | ipywidgets | Jupyterlab |
|---|---|---|---|
| 0.2.0 | 2.x | N/A | N/A |
| 0.3.x | 3.x | N/A | N/A |
| 0.3.x | 4.0 | 4.0.x | N/A |
| 0.3.x | 4.1 | 4.1.x | N/A |
| 0.3.2 | 4.2 | 5.x | N/A |
| 0.3.3 | 5.x | 6.x | N/A |
| 1.0.x | 5.x | 7.x | 0.30.x |
There are a couple of demo notebooks in the qgrid-notebooks repository which will help you get familiar with the functionality that qgrid provides. Here are the steps to clone the qgrid-notebooks repository and open a demo notebook:
Install qgrid by following the instructions in the Installation section above, if you haven't already
Clone the qgrid-notebooks repository from GitHub:
git clone https://github.com/quantopian/qgrid-notebooks.git
Install the dev requirements for the repository and start the notebook server:
cd qgrid-notebooks
pip install -r requirements_dev.txt
jupyter notebook
Click on one of the two notebooks (index.ipynb or experimental.ipynb) that you see listed in the notebook UI in your browser.
If you'd like to contribute to qgrid, or just want to be able to modify the source code for your own purposes, you'll want to clone this repository and run qgrid from your local copy of the repository. The following steps explain how to do this.
Clone the repository from GitHub and
cdinto the top-level directory:git clone https://github.com/quantopian/qgrid.git cd qgrid
Install the current project in editable mode:
pip install -e .
Install the node packages that qgrid depends on and build qgrid's javascript using webpack:
cd js && npm install .
Install and enable qgrid's javascript in your local jupyter notebook environment:
jupyter nbextension install --py --symlink --sys-prefix qgrid && jupyter nbextension enable --py --sys-prefix qgrid
Run the notebook as you normally would with the following command:
jupyter notebook
If the code you need to change is in qgrid's python code, then restart the kernel of the notebook you're in and rerun any qgrid cells to see your changes take effect.
If the code you need to change is in qgrid's javascript or css code, repeat step 3 to rebuild qgrid's npm package, then refresh the browser tab where you're viewing your notebook to see your changes take effect.
There is a small python test suite which can be run locally by running the command pytest in the root folder
of the repository.
The read-the-docs page is generated using sphinx. If you change any doc strings or want to add something to the read-the-docs page, you can preview your changes locally before submitting a PR using the following commands:
pip install sphinx sphinx_rtd_theme
cd docs && make html
This will result in the docs/_build/html folder being populated with a new version of the read-the-docs site. If
you open the index.html file in your browser, you should be able to preview your changes.
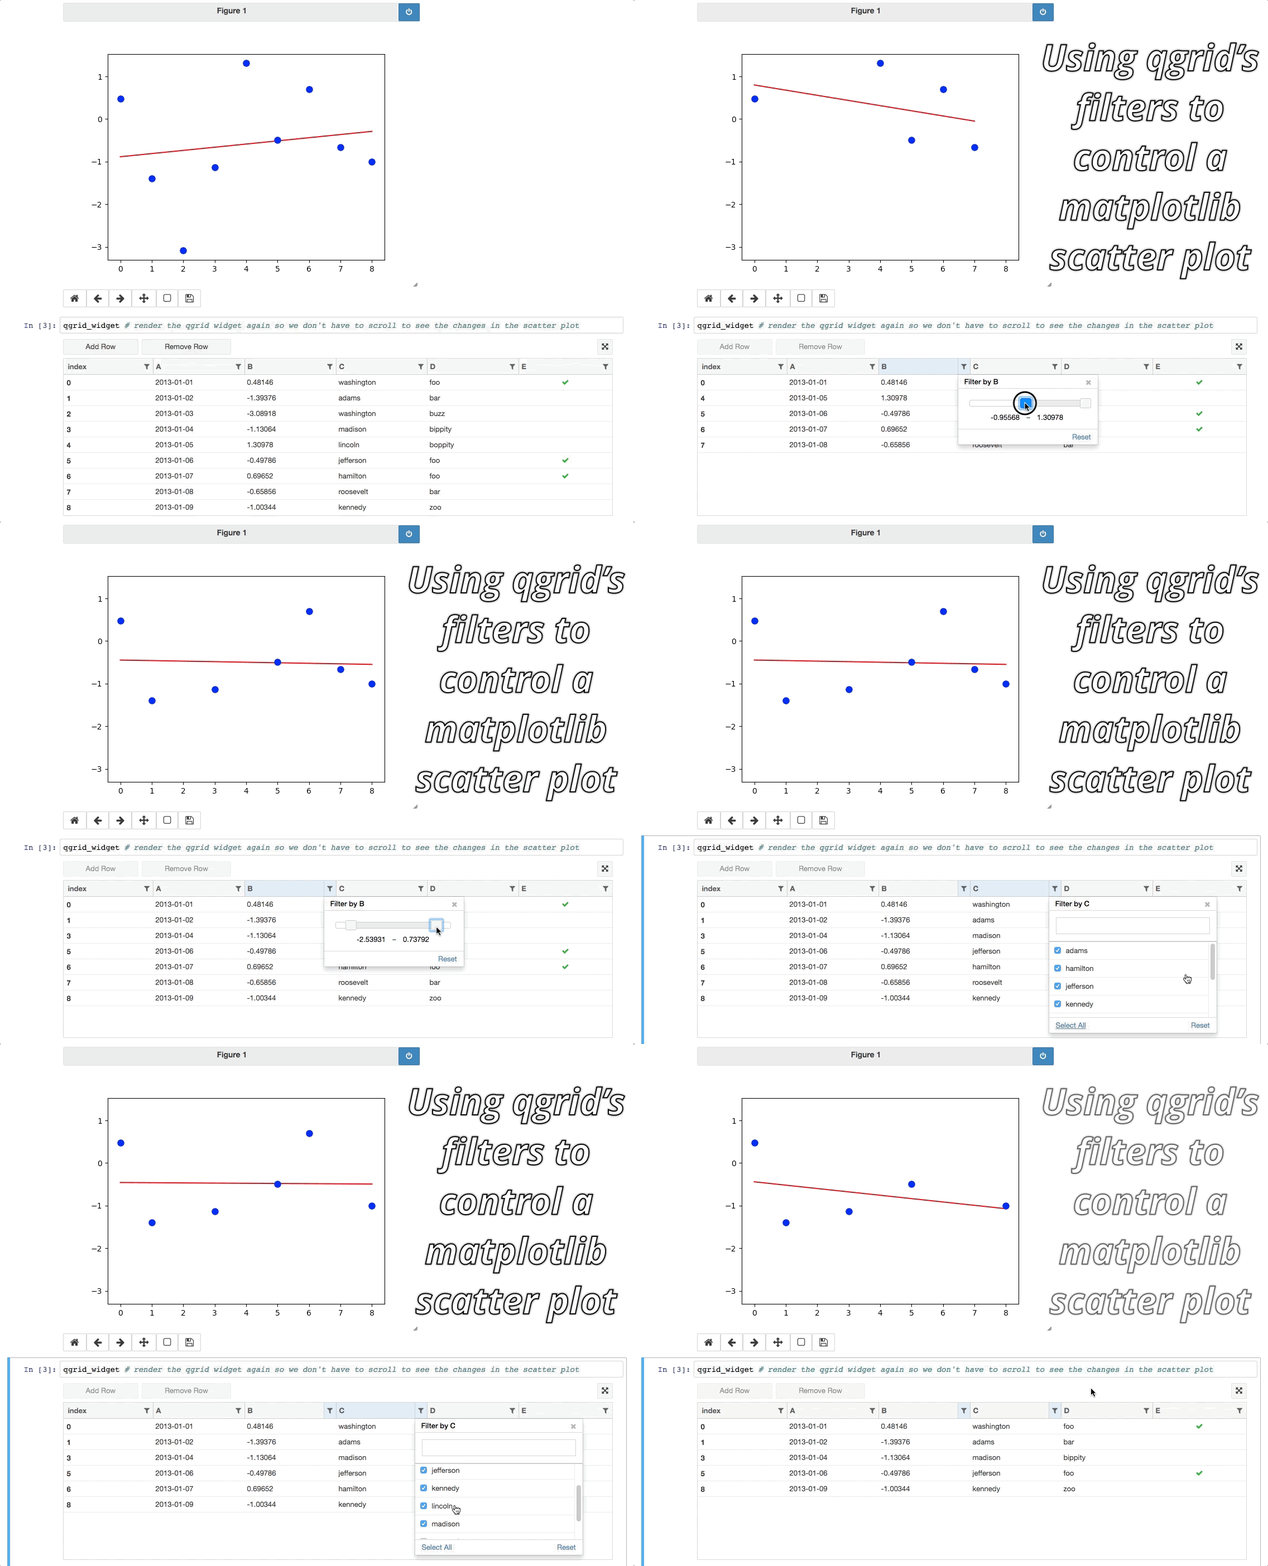
As of qgrid 1.0 there are some interesting ways we can use qgrid in conjunction with other widgets/visualizations. One example is using qgrid to filter a DataFrame that's also being displayed by another visualization.
Currently these ways of using qgrid are not documented in the API docs or extensively tested, so they're still considered experimental. See the experimental notebook to learn more.
For people who would rather not go to another page to try out the experimental notebook, here's the tldr; version:
If you're looking for the installation and usage instructions for qgrid 0.3.3 and the sample notebook that goes along with it, please see the qgrid 0.3.3 tag in this repository. The installation steps will be mostly the same. The only difference is that when you run "pip install" you'll have to explicitly specify that you want to install version 0.3.3, like this:
pip install qgrid==0.3.3
If you're looking for the API docs, you can find them on the readthedocs page for qgrid 0.3.3.
If you're looking for the demo notebook for 0.3.3, it's still availabe in nbviewer.
Qgrid 0.3.3 is not compatible with ipywidgets 7, so if you need support for ipywidgets 7, you'll need to use qgrid 1.0.
All contributions, bug reports, bug fixes, documentation improvements, enhancements, and ideas are welcome. See the Running from source & testing your changes section above for more details on local qgrid development.
If you are looking to start working with the qgrid codebase, navigate to the GitHub issues tab and start looking through interesting issues.
Feel free to ask questions by submitting an issue with your question.

