-
Notifications
You must be signed in to change notification settings - Fork 140
085_option_array_func
Previous Chapter Previous Page Next Page Table of content
Several options and datasets/data elements can now have an array or a function as value. This enhancement (introduced in ChartNew.js version 2) make possible the creation of more flexible charts.
This possibility has not been implemented for all options; It has only be implemented for options where it could be useful. If you have to implement it to an additional option, minor changes in the code of ChartNew.js are necessary.
Through an example (code in Samples/issue_205.html), you will understand how to use it !
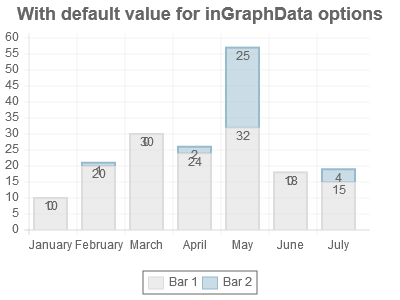
If you have a stacked chart with two values on each stack ; the second value on the stack is small. If you want to get the values in the chart, you specify following options :
  var opts1= {
animation : false,
legend : true,
inGraphDataShow : true,
datasetFill : false,
inGraphDataYPosition: 3,
inGraphDataVAlign: "top",
inGraphDataPaddingY: -3,
graphTitleFontSize: 18,
graphTitle : "With default value for inGraphData options"
};
As you can see, small values from the second values overlap the values of the first ones.
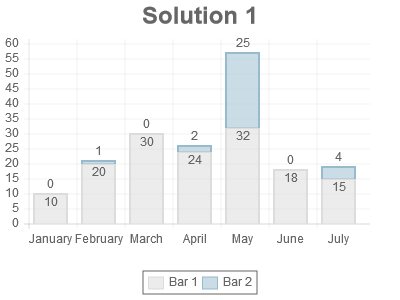
Since version 2.0, you can now specify an array for several options among which inGraphDataYPosition, inGraphDataVAlign and inGraphDataPaddingY :
  var opts2= {
animation : false,
legend : true,
inGraphDataShow : true,
datasetFill : false,
inGraphDataYPosition: [3,3],
inGraphDataVAlign: ["top","bottom"],
inGraphDataPaddingY: [-3,3],
graphTitle : "Solution 1"
};
Much better !
So when you are allowed to specify an array for an options, the first value of the array will be for the first dataset/data element; The second one will be for the second dataset/data element; etc...
If there are more datasets/data elements than entries in the array, the last entry will be used for the missing values.
If for a specific option, ChartNew.js is does not allow an array value, it should not be difficult to update the code in order to allow an array value. Just open an issue and ask it !
Instead of defining an array, you can associate a function to an option. Using a function is much more flexible but ... you have to write the function yourself.
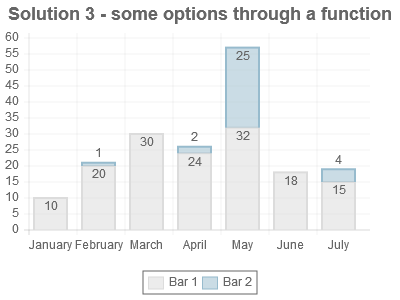
In previous sample, the bar under "25" is big enough to write the value inside the bar.
With following definitions, you can produce a chart where the value 25 is written inside the bar.
 function computeInGraphVAlign(area, ctx, data,statData, posi,posj,othervars) {
if(posi==1 && 1*data.datasets[posi].data[posj]<6) return("bottom");
else return("top");
 }

 function computeInGraphPaddingY(area, ctx, data,statData, posi,posj,othervars) {
if(posi==1 && 1*data.datasets[posi].data[posj]<6) return(3);
else return(-3);
 }

  var opts4= {
animation : false,
legend : true,
inGraphDataShow : true,
datasetFill : false,
inGraphDataYPosition: 3,
inGraphDataVAlign: computeInGraphVAlign,
inGraphDataPaddingY: computeInGraphPaddingY,
inGraphDataTmpl: "<%=(v3 > 0 ? v3 : '')%>",
graphTitleFontSize: 18,
graphTitle : "Solution 3 - some options through a function"
};
A separate chapter describes how to write a function and the parameters passed to the function. see Option functions


