-
Notifications
You must be signed in to change notification settings - Fork 140
900_050_Shapes Text Images_In_Chart
Previous Chapter Previous Page Next Page Table of content
The add-ins module "shapesInChart.js" is a powerful module that makes possible to draw shapes (rectangle, circle, ellipse, triangle and lot of other shapes), lines, arrows, text, images or self written element in a chart.
This document describes how to use the shapesInChart.js Add-In.
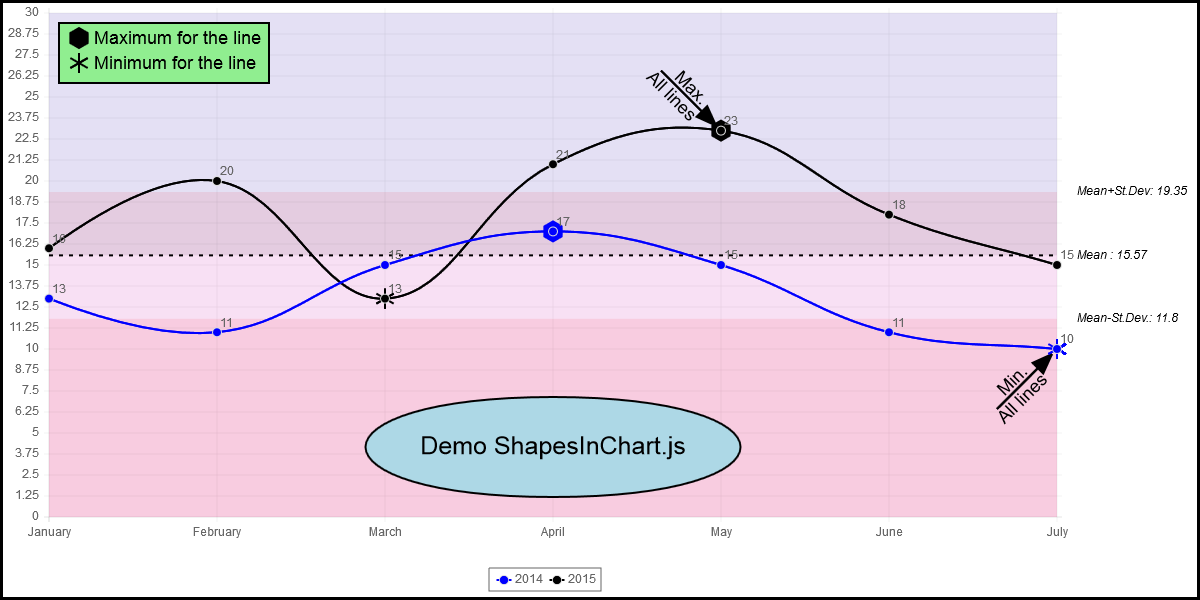
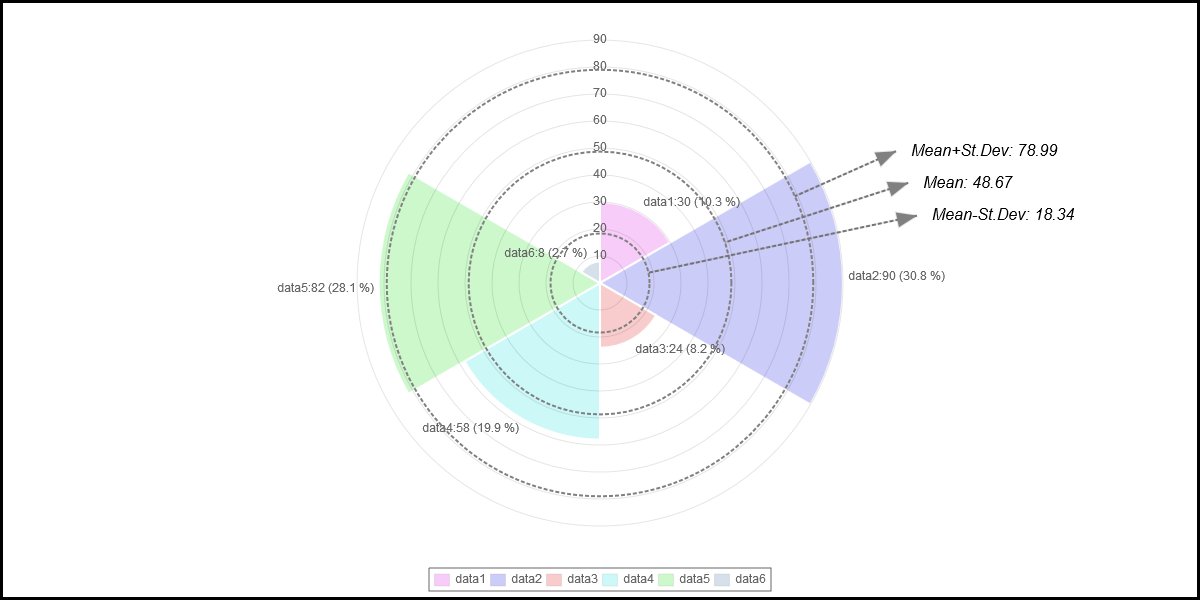
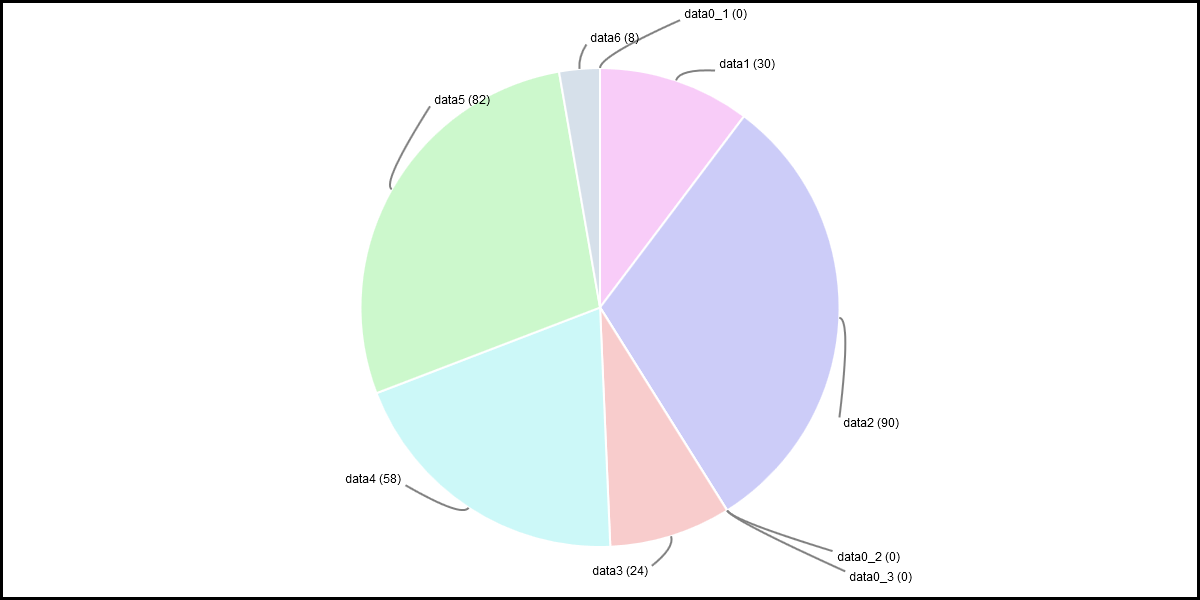
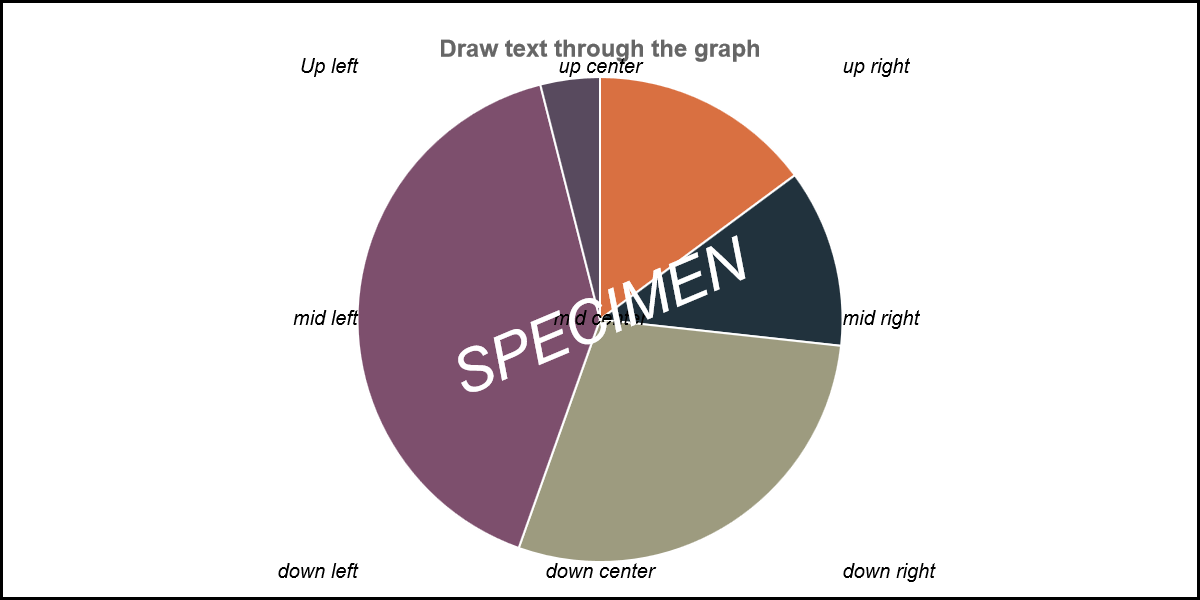
Examples of what can be produced thanks this module :
-
In your sources, include the "Add-ins\shapesInChart.js" module.
<SCRIPT src='../Add-ins/shapesInChart.js'></script>
-
For adding shapes/text/images/lines/arrows in a chart add a "shapesInChart" array in the data
Example :
var mydata1 = {
labels : ["January","February","March","April","May","June","July"],
datasets : [
	{
		fillColor : "rgba(220,220,220,0.5)",
		strokeColor : "rgba(220,220,220,1)",
		pointColor : "rgba(220,220,220,1)",
		pointstrokeColor : "yellow",
		data : [10,14,16,17,13,10,12],
		title : "2014"
	},
	{
		fillColor : "rgba(151,187,205,0.5)",
		strokeColor : "rgba(151,187,205,1)",
		pointColor : "green",
		pointstrokeColor : "yellow",
		data : [6,10,9,10,7,6,10],
		title : "2013"
	}
],
shapesInChart : [
	{
		position : "INGRAPH",
		shape: "RECTANGLE",
		fillColor: "rgba(220,0,200,0.2)",
		strokeColor : "rgba(0,0,0,0)",
		animate : false,
		x1: -999,
		y1: 8,
		x2: +999	,
		y2: 12,
	},
	{
		position : "INGRAPH",
		shape: "LINE",
		strokeStyle : "dashSpace",
		x1: -999,
		y1: 10,
		x2: +999	,
		y2: 10,
	}
]
}
- Associate the function "drawShapes" to at least one of the following options : initFunction, beforeLabelsFunction, afterLabelsFunction, beforeDrawFunction, endDrawScaleFunction and/or endDrawDataFunction. See Other options
Several samples can be found in the Samples folder :
- Samples\shapesInChart_for_LineChart.html
- Samples\shapesInChart_for_PolarAreaChart.html
- Samples\shapesInChart_for_PieChart.html
- Samples\crossImages.html (*)
- Samples\multigraphonsinglecanvas.html (*)
- Samples\stats_doughnut.html (*)
- Samples\issue_62.html (*)
- Samples\clicktextwithmouse.html (*)
(*) in those samples, the deprecated "crossText" and "crossImage" options have been replaced with codes associates to the Add-ins "shapesInChart.js".
Several variables can be specified for each element of shapesInChart; The variables are divided in 3 categories : (1) when should the shape be drawn, (2) which shape to draw and shape specifications, (3) where should the shape be drawn.
Allowed Value : "initFunction", "beforeLabelsFunction", "afterLabelsFunction", "enddatafunction", "endscalefunction" or "always"
Default Value : "always"
Description : "when" is initialized with value "initFunction", this shape will be drawn only during the call of the initFunction; If "when" is initialized with value "beforeLabelsFunction", this shape will be drawn only during the call of the beforeLabelsFunction; If "when" is initialized with value "afterLabelsFunction", this shape will be drawn only during the call of the afterLabelsFunction; If "When" is initialized with value "enddatafunction", this shape will be drawn only during the call of the endDrawDataFunction; if "when" is initialized with value "endscalefunction", the shape will be drawn only during the call of the endDrawScaleFunction; if "when" is initialized with value "always", the shape will always be drawn regardless of the calling function.
Allowed Value : "first", "last", "all" or a positive integer
Default Value : "all"
Description : "iter" has value "first", the shape will only be drawn at first iteration of the animation; if "iter" has value "last", the shape will only be drawn at last iteration of the animation; if "iter" as a positive integer value, the shape will only be drawn at the iteration corresponding to this value; if "iter" has value "all", the shape will always be drawn.
There is one another variable that can be used to specify if a shape has to be displayed in the chart, but this variable has to be defined in the options of the chart. The dispShapesInChart option variable can be true (default value), false or an array of integers.
If the value is true, the shapes will be displayed according the values in the "iter" and the "when" variables;
If the value is false, shapes will not be displayed in the chart;
If the value is an array of integer, only the shapes specified in the array will be displayed according the "iter" and the "when" variable. For instance, config.dispShapesInChart=[0,2] only the first and the thrid shapes will be drawn in the chart.
Why is this useful ? Suppose that you have a single set of data in which you have specified several shapes and that 2 charts use the same data. In one of the chart, you want to see some of the shapes and in the other chart, the other shapes. The only solution to implement this is to use the dispShapesInChart option.
See : Samples\crossImage.html.
Allowed Value : "Circle", "Ellipse", "Rectangle", "Line", "Arrow", "Text", "Image", "Star", "Plus", "Cross", "Triangle", "Square", "Diamond", "RegularShape", "MyShape" or a user written function (see other chapter in this document).
Default Value : "Circle"
Description : specify the shape that you want to draw.
Applies to shapes : "Circle", "Ellipse", "Rectangle", "Line", "Arrow", "Text" (border around the text), "Star", "Plus", "Cross", "Triangle", "Square", "Diamond", "RegularShape", "MyShape"
Default Value : strokeStyle: "solid", strokeSize:2, strokeColor : "black"
Description : those 3 variables specifies the characteristics of the lines of the shape;
Applies to shapes : "Circle", "Ellipse", "Rectangle", "Text" (color behind the text), "Triangle", "Square", "Diamond", "RegularShape", "MyShape"
Default Value : fillColor: "blue"
Description : specifies the fill color of the shape;
Applies to shapes : "Circle", "Triangle", "Square", "Diamond", "RegularShape"
Default Value : radius : 10
Description : radius of the smallest virtual circle surrounding the shape.
If radius has a negative value, the radius of the virtual circle will be computed has the distance between (x1,y1) and (x2,y2);
Applies to shapes : "Ellipse"
Default value : ellipseHeight : 20, ellipseWidth : 40
Description : dimensions of the ellipse
Applies to shapes : "RegularShape"
Default Value : sideCount : 4
Description : number of side of the regular shape to draw (example: sideCount=6 => hexagon).
Applies to shapes : "Star"
Default Value : lineCount : 3
Description : number of branch for the star (example: lineCount=2 => plus sign);
Applies to shapes : "Text", "Image", "Star", "Plus", "Cross", "Triangle", "Square", "Diamond", "RegularShape"
Default Value : rotate : 0
Description : shape rotation
Applies to shapes : "Circle"
Default Value : startAngle : 0, endAngle : 360
Description : if you want to draw only a piece of the circle, specify the start and end angles;
Applies to shape : "Arrow"
Default value : arrowTop : true, arrowBottom : false
Description : for the "arrow" shape, use arrowTop and arrowBottom to specify on which edge you want an tip;
Applies to shape : "Arrow"
Default Value : arrowWidth : 15, arrowHeight : 20
Description : for the "Arrow" shape, use arrowWidth and arrowHeight to specify the width and the height of the tip of the arrow.
Applies to shape : "Text"
Default Value : text : "Your Text"
Description : text to be displayed.
The "text" can also be associated to a function. This is useful when the text that has to be displayed during the animation evoluates. See Samples\evolutiveText_in_chart.html.
Parameter passed to the function : (shapeNumber, null, ctx, config, xpos,ypos, borderX,borderY, true, data, animationValue, othervars).
- shapeNumber : shape number in processed;
- ctx : context;
- config : options for the chart;
- (xpos,ypos) : position in the chart where the text will be drawn;
- data : data used for the chart;
- animationValue : current animation value (value between 0 and 1; 1 <=> last step of the animation);
- othervars : see description in Other options
Applies to shape : "Text"
Default Value : textAlign : "center", textBaseline : "middle", fontColor : "rgba(220,220,220,1)", fontStyle : "normal", fontSize : 12, fontFamily : "'Arial'"
Description : text specifications
Applies to shape : "Text"
Default Value : textBorders : false
Description : should a border be drawn around the text .
textBordersColor, textBordersWidth, textBordersXSpace, textBordersYSpace, textBordersStyle, textBackgroundColor
Applies to shape : "Text"
Default Value : textBordersColor : "black", textBordersWidth : 1, textBordersXSpace : 3, textBordersYSpace : 3, textBordersStyle : "solid", textBackgroundColor : "none"
Description : specification of the border around the text; See Also : fillColor.
Applies to shape : "Image"
Default value : imagesrc : ""
Description : source of the image (most of the time, location of the "*.JPG" file)
ATTENTION : the image defined through the imagesrc option is loaded during the execution of the code of ChartNew.js but ... it could be the the load is not terminated when the image should be displayed. To avoid this you can used the loadImage variable instead.
Applies to shape: "Image"
Default value : no default value.
Description : The simplest way to specify the image that has to be drawn is to use the imagesrc variable described here before. But the imagesrc variable has a default : you are not sure that the image is loaded when it has to be displayed. To avoid this, you can use the loadImage instead. The loadImage is an 'image variable'(=new Image() ). See on the web how to use Image variables.
Applies to shape : "Image"
Default value : imageAlign : "center", imageBaseline : "middle"
Description : image alignment to (x1,y1).
Applies to shape : "Image"
Default value : (real image size)
Description : make it possible to resize the image.
Applies to shape : "Circle", "Ellipse", "Rectangle", "Line", "Arrow", "Text", "Star", "Plus", "Cross", "Triangle", "Square", "Diamond", "RegularShape"
Default value : animate : false
Description : if set to true, the shape will appear evolutively during the animation;
Applies to shape : "myShape"
Default value : none
__Description __ : if your shape is defined has "myShape", you have to define a shapePoint and shapePadding arrays. The shapePoint array must contains all tops of your shapes.
- shapePoint : [[x1,y1],[x2,y2],[x3,y3],[x4,y4],....]
- shapePadding : [[paddingX1,paddingY1],[paddingX2,paddingY2],[paddingX3,paddingY3],[paddingX4,paddingY4],....]
Description of (x1,y1) and (paddingX1,paddingY1) can be found here after).
The position where the shape is drawn is of course important. Through variables, you can specify up to 4 points in the chart : (x1,y1), (x2,y2), (x3,y3) and (x4,y4). For some shapes, only (x1,y1) is used; for other shapes, (x1,y1) and (x2,y2) are used; (x3,y3) and (x4,y4) are for user defined shapes (through a self written function).
For "Circle", "Star", "Plus", "Cross", "Triangle", "Square", "Diamond" and "RegularShape", the center of the shape is set through the (x1,y1) position. If the radius is a negative value, the distance between (x1,y1) and (x2,y2) is used as radius.
For "Ellipse", the center of the shape is set through the (x1,y1) position.
For "Text" and "Image", (x1,y1) is the reference point associated to the alignment (see textAlign, textBaseline, imageAlign and imageBaseline).
For "Rectangle", (x1,y1) and (x2,y2) are the reference of the opposite corners;
For "Line" and "Arrow", (x1,y1) and (x2,y2) are the reference of the edges;
But how to set the reference to a specific point in the context ?
The variable "position" is the most important variable for the position. This variable can have 3 different values : "ABSOLUTE", "RELATIVE" and "INGRAPH" ("INGRAPH" is the default value).
Descriptions here after always takes (x1,y1) has reference; But it is of course the same for (x2,y2), (x3,y3) and (x4,y4).
(x1,y1) is the real position in the context associated to :
x1 = sum of variable x1 and variable paddingX1; y1 = sum of variable y1 and variable paddingY1;
Examples:
x1:0, y1:0, paddingX1:0, paddingY1:0 => top left corner of the context;
x1: context.width, y1:context.height, paddingX:0, paddingY: 0 : bottom right corner of the context.
if variable x1 has the value 0, the shape will be drawn at the left of the context with a displacement of paddingX1 points;
if variable x1 has the value 1, the shape will be drawn at the left of the chart with a displacement of paddingX1 points;
if variable x1 has the value 2, the shape will be drawn at the center of the chart with a displacement of paddingX1 points;
if variable x1 has the value 3, the shape will be drawn at the right of the chart with a displacement of paddingX1 points;
if variable x1 has the value 4, the shape will be drawn at the right of the context with a displacement of paddingX1 points;
if variable x1 has the value -2, the shape will be drawn at the middle of the context with a displacement of paddingX1 points;
if variable y1 has the value 0, the shape will be drawn at the top of the context with a displacement of paddingY1 points;
if variable y1 has the value 1, the shape will be drawn at the top of the chart with a displacement of paddingY1 points;
if variable y1 has the value 2, the shape will be drawn at the middle of the chart with a displacement of paddingY1 points;
if variable y1 has the value 3, the shape will be drawn at the bottom of the chart with a displacement of paddingY1 points;
if variable y1 has the value 4, the shape will be drawn at the bottom of the context with a displacement of paddingY1 points;
if variable y1 has the value -2, the shape will be drawn at the middle of the context with a displacement of paddingY1 points;
Examples:
x1:0, y1:0 => top left corner of the context;
x1:2, y1:2 => middle of the chart;
x1:-2, y1:-2 => middle of the context;
x1:4, y1:4 => bottom right corner of the context.
To be concise, if position has the value "INCHART", the variables x1 and y1 refer to the position (x1,y1) in the chart. The variables paddingX1 and paddingY1 specify a displacement in points on the X axis and on the Y axis.
For Line:
- x1=0 for the position of the first label (left of the chart); x1=1 for the position of the second label; etc...
- y1 is associated to the real position in the chart on the Y-Axis;
For Bar, StackedBar, HorizontalBar, HorizontalStackedBar:
- x1=0 for the middle position of the first bar group ; x1=1 for the middle position of the second group of bar; x1=-0.5, for the left edge of the chart; x1=0.5, for the position between the first and the second group of bars; etc...
- y1 is associated to the real position in the chart on the Y-Axis;
For Pie and Doughnut:
- x1=-0.5 for the "top" edge of the first slice; x1=0 for the midle of the first slice; x1=0.5 for the edge between the first and the second slices; x1=1 for the middle of the second slice; etc...
- y1=0 is associated to the position of the internal circle of the doughnut (the center of the Pie for Pie) and y1=1 is associated to the position of the external circle of the doughnut. => y1=0.5 is associated to the middle of the slices;
For PolarArea:
- x1=-0.5 for the "top" edge of the first slice; x1=0 for the midle of the first slice; x1=0.5 for the edge between the first and the second slices; x1=1 for the middle of the second slice; etc...
- y1 is associated to the real position in the chart;
For Radar:
- x1=0 for the first label; x1=1 for the second label; etc... (x1 can only be initialized with an integer value);
- y1 is associated to the real position in the chart on the Y-Axis;
In some case, you may want to be limited to the chart area even if your reference exceed the chart; If you set variable limitToChart to true, you will never refers to a point outside the chart.
If you want to insert another shape in the chart, you can write a function to drawn you own shape. To do that, you have to write a function to draw your shape and associate the name of the function to the variable "shape".
See following sample : Samples\shapesInChart_for_PieChart.html.
Stats.js add-ins (see statistics)
For all values in shapesInChart array, you can specify a value computed and replaced by the stat.js add-ins.
See following samples :
- Samples\shapesInChart_for_LineChart.html
- Samples\shapesInChart_for_PolarAreaChart.html
In some cases, you want to associate to a parameter a value that is computed during the display of the chart. This can be done...
If, for a parameter, you associates a string starting with "%eval(", you can associate an evaluated value to a parameter. The evaluation of the value will be performed at the time the parameter is used.
For instance, you want to associate the middle value of the y axis to y1. The minimum value is stored in statData[0][0].minGraph and the maximum in statData[0][0].maxGraph. If you set y1="%eval((statData[0][0].graphMin+statData[0][0].graphMax)/2)", y1 will be associated to the middle value of the y axis.


