-
Notifications
You must be signed in to change notification settings - Fork 140
150_Missing_Values
Previous Page Next Page Table of content
Statistically spoken, a missing value is something important. Lot of applications interpret incorrectly missing values as zero.
If among 5 students, you know the result of 4 of them, you should not compute the average as the sum of the 4 known results divided by 5. Unfortunately, lot of applications does.
Similarly, when you raise the temperature each day, if you report the result on a line chart, you should not report a line to zero for the days that you omit to take the mesure.
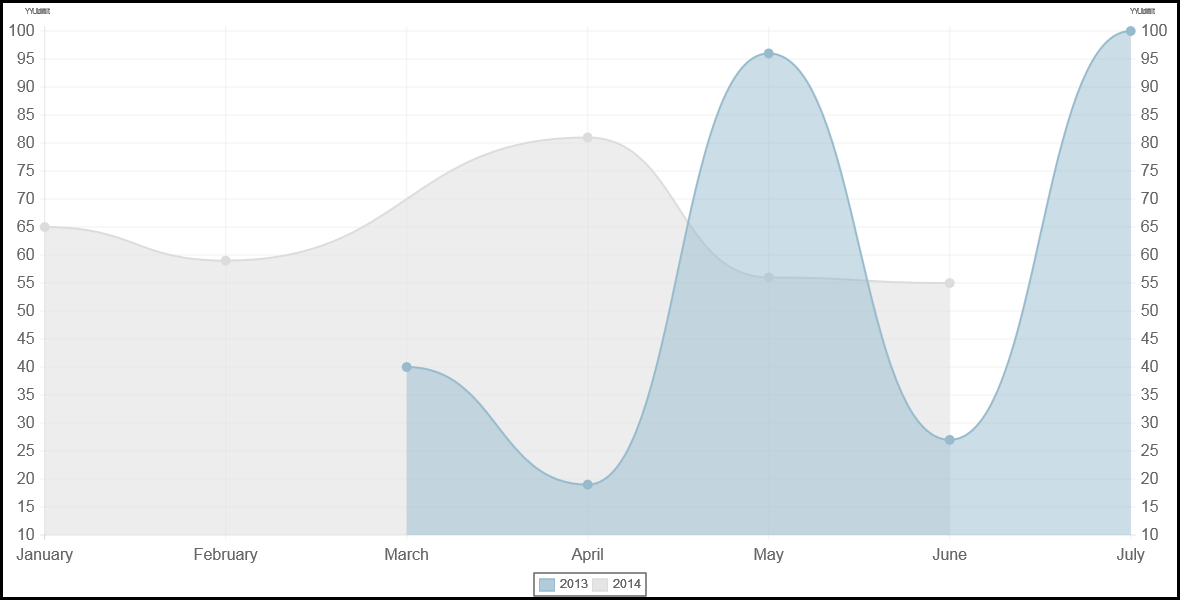
ChartNew.js take account of missing values and chart will not report missing values as zero. How do you specify a missing value in your data ? When nothing is specified for a value, the value will be considered as a missing value.
Example :
var datamissing = {
labels : ["January","February","March","April","May","June","July"],
datasets : [
	{
		fillColor : ["rgba(220,220,220,0.5)"],
		strokeColor : "rgba(220,220,220,1)",
		pointColor : "rgba(220,220,220,1)",
		pointstrokeColor : "#fff",
		data : [65,59,,81,56,55,],
                    title : "2014"
	},
	{
		fillColor : "rgba(151,187,205,0.5)",
		strokeColor : "rgba(151,187,205,1)",
		pointColor : "rgba(151,187,205,1)",
		pointstrokeColor : "#fff",
		data : [,,40,19,96,27,100],
                    title : "2013"
	}
]
}
Attention : do not specify a missing value as two (double) quotes :’’ and “” are considered as a zero value.
If you prefer that points between missing values are not linked, set option "extrapolateMissingData : false"
